OPEN-SOURCE SCRIPT
已更新 IFR2
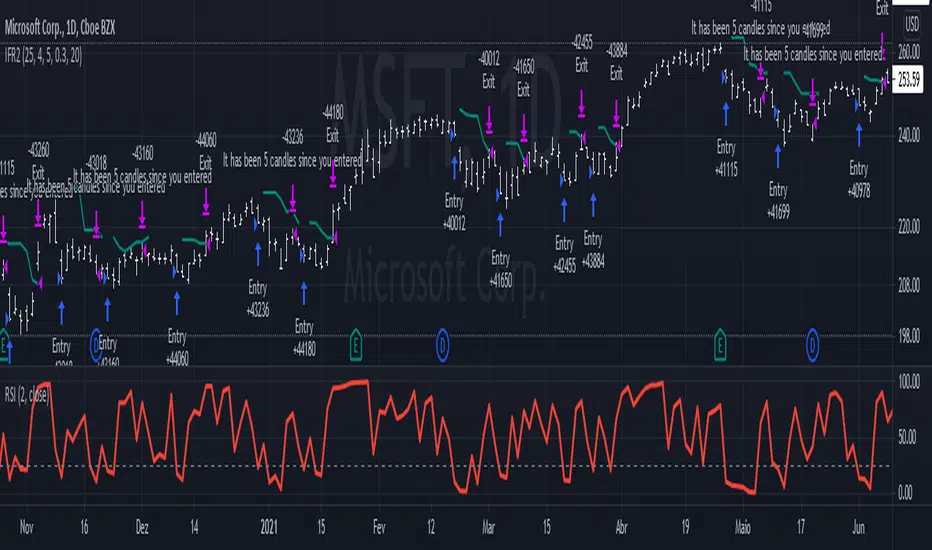
The IFR2 strategy is based on the RSI indicator.
If the two period RSI is less than the overbought level (25 is the default, but you can configure it to be lower), a long position is placed at the close of the candle. If you are doing it live, you'd have to enter the market ~ 10 minutes before it closes, check the RSI, and buy if it is lower than your overbought level. This generates a discrepancy in the backtesting, but since it is a very small difference, it can be disregarded. Higher overbought levels generate more signals, but they mostly are unreliable. Lower values generates better yields, but they won't occur very often. This strategy is designed to be used in a daily graph, and I don't recommend using it in intraday periods, since you'll make too little money to compensate for the operational cost.
The strategy exits when the high price of two previous candles is reached. If the exit price is higher than the closing price of when you entered, you'll be at a profit, otherwise you'll be at a loss. The exit price is plotted in the graph and it's colors depends on the current open profit: positive values will be green, negative will be red.
This strategy completely disregards the current trend. Long orders will be placed even if you are at a strong down trend. This may seem odd, but you have to keep in mind that this is a volatility based strategy, not a trend following one.
This setup was designed by Alexandre Wolwacz, a.k.a. Stormer.
發行說明
Updated the strategy to include different types of exit points. Now you can choose to exit on the highest of previous candles (the default setting), when the RSI is oversold, or when the price closes above the short moving average.You can also configure to take trades only when the moving averages are trending. This kinda defeats the purpose of the strategy, since it is not a trend following strategy, but I found that is some assets it may work better to filter the trades.
發行說明
Added the ability to go short.發行說明
I simplified the script and added a starting date as requested by a user.發行說明
Now it uses the new time entry function, so it is much more accurate. In addition, you can define a custom ATR period.發行說明
I made use of the new inline and group features on the input functions, so now they should be clearer and better organized. 發行說明
I've been showing the wrong oscillator since the last update, now it should be corrected.發行說明
I made some changes to the code to make the script load faster.開源腳本
秉持TradingView一貫精神,這個腳本的創作者將其設為開源,以便交易者檢視並驗證其功能。向作者致敬!您可以免費使用此腳本,但請注意,重新發佈代碼需遵守我們的社群規範。
免責聲明
這些資訊和出版物並非旨在提供,也不構成TradingView提供或認可的任何形式的財務、投資、交易或其他類型的建議或推薦。請閱讀使用條款以了解更多資訊。
開源腳本
秉持TradingView一貫精神,這個腳本的創作者將其設為開源,以便交易者檢視並驗證其功能。向作者致敬!您可以免費使用此腳本,但請注意,重新發佈代碼需遵守我們的社群規範。
免責聲明
這些資訊和出版物並非旨在提供,也不構成TradingView提供或認可的任何形式的財務、投資、交易或其他類型的建議或推薦。請閱讀使用條款以了解更多資訊。