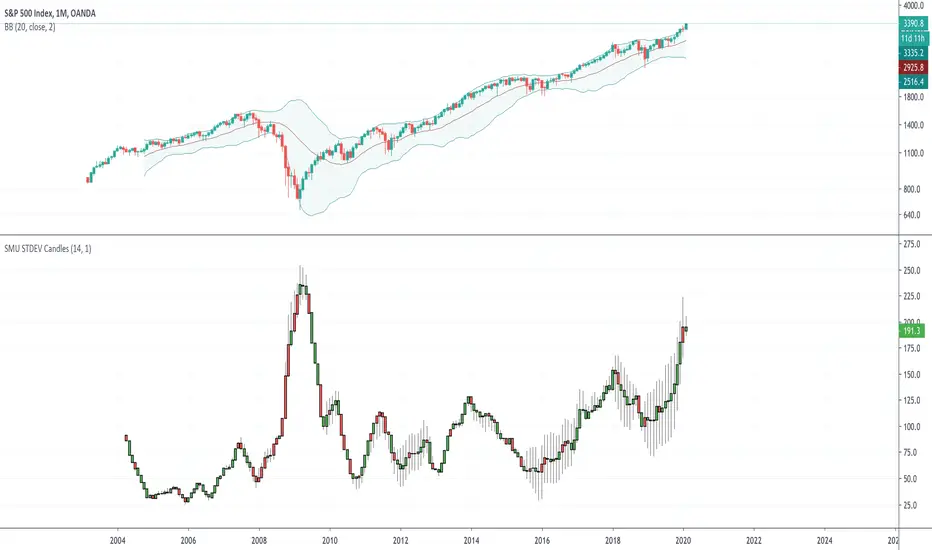
This script creates a STDEV in a candle format so you can see the Change in a candle format and compare it with the actual price candle.
Is very similar to SMU RSI and SMU ROC. The interesting part is to see the full effect of traditional indicators in a candle format rather than a simple plot format. Very interesting view in SPX. There is a very big clue in the chart as STDEV changed since 2008. Can you figure it out?
Also, try this in lower time frame and you will be amazed how Algo kills volatility after each upside or downside. Fascinating
開源腳本
秉持TradingView一貫精神,這個腳本的創作者將其設為開源,以便交易者檢視並驗證其功能。向作者致敬!您可以免費使用此腳本,但請注意,重新發佈代碼需遵守我們的社群規範。
免責聲明
這些資訊和出版物並非旨在提供,也不構成TradingView提供或認可的任何形式的財務、投資、交易或其他類型的建議或推薦。請閱讀使用條款以了解更多資訊。
開源腳本
秉持TradingView一貫精神,這個腳本的創作者將其設為開源,以便交易者檢視並驗證其功能。向作者致敬!您可以免費使用此腳本,但請注意,重新發佈代碼需遵守我們的社群規範。
免責聲明
這些資訊和出版物並非旨在提供,也不構成TradingView提供或認可的任何形式的財務、投資、交易或其他類型的建議或推薦。請閱讀使用條款以了解更多資訊。