PROTECTED SOURCE SCRIPT
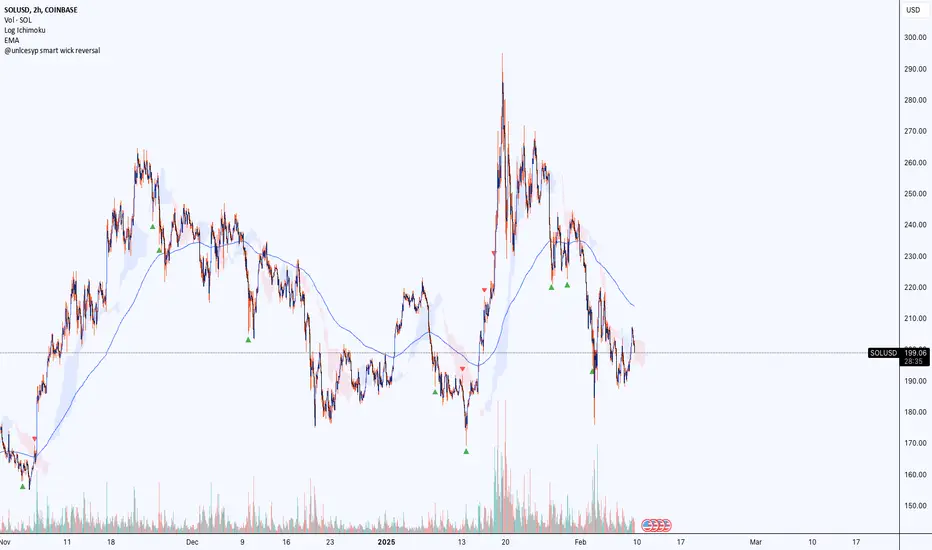
@unlcesyp smart wick reversal
@unlcesyp smart wick reversal
This indicator helps you spot potential market reversals by highlighting abnormal wicks that often signal a turning point. It adapts to changing market volatility and volume, making it more reliable across different market conditions.
How It Works
1. Wick Analysis
- Measures upper and lower wicks over a chosen lookback period.
- Calculates the average and standard deviation of these wicks, then flags “abnormally long” wicks.
2. Adaptive Volatility
- Uses an ATR-based volatility factor to adjust the wick threshold.
- In high-volatility conditions, the threshold is higher, reducing false signals.
3. Trend Check
- Select either an SMA or EMA to determine if the market is in an uptrend or downtrend.
- A large upper wick in an uptrend can signal bullish exhaustion (potential reversal down).
- A large lower wick in a downtrend can signal bearish exhaustion (potential reversal up).
4. Optional Volume Confirmation
- Checks if volume is above its average to ensure strong participation in the move.
- Helps filter out weak, low-volume signals.
5. Signals
- Red ▼ (triangle down) = Potential Bearish Reversal
- Green ▲ (triangle up) = Potential Bullish Reversal
Why Use It?
- Adaptive: Automatically adjusts to changes in market volatility.
- Flexible Trend Basis: Choose SMA or EMA for calculating market trend.
- Volume Filter: Adds an extra layer of confirmation.
- Clear Visuals: Marks potential reversals with simple, unobtrusive shapes.
Inputs Explained
1. Lookback Period for Wick Analysis (`length`)
- Default: 20
- Number of bars used to calculate wick averages. Higher values = smoother signals; lower values = more reactive.
2. ATR Length for Volatility Filtering (`atr_length`)
- Default: 14
- Number of bars the ATR uses to gauge volatility.
3. Base Threshold Multiplier (`base_multiplier`)
- Default: 2.0
- Multiplier for standard deviation of wicks. Higher = fewer (but potentially stronger) signals.
4. Volatility Sensitivity Factor (`volatility_sensitivity`)
- Default: 1.5
- Adjusts how much volatility affects the threshold. Higher = more adaptive; lower = more stable.
5. Enable Volume Confirmation (`volume_filter`)
- Default: true
- When enabled, signals only appear if volume exceeds its average by a specified multiplier.
6. Volume Spike Multiplier (`vol_multiplier`)
- Default: 1.5
- Determines how much above average volume must be to confirm a signal.
7. Trend Calculation Method (`trendMethod`)
- Options: “SMA” or “EMA”
- Determines the type of moving average to evaluate the market trend for exhaustion signals.
Best Practices
- Combine with other price action or technical indicators to confirm signals.
- Use on multiple timeframes for a broader market perspective.
- Adjust parameters (`length`, `atr_length`, `base_multiplier`) for different assets or personal preference.
受保護腳本
此腳本以閉源形式發佈。 不過,您可以自由使用,沒有任何限制 — 點擊此處了解更多。
免責聲明
這些資訊和出版物並非旨在提供,也不構成TradingView提供或認可的任何形式的財務、投資、交易或其他類型的建議或推薦。請閱讀使用條款以了解更多資訊。
免責聲明
這些資訊和出版物並非旨在提供,也不構成TradingView提供或認可的任何形式的財務、投資、交易或其他類型的建議或推薦。請閱讀使用條款以了解更多資訊。