PROTECTED SOURCE SCRIPT
Trend Continuation — Compact HUD Pane
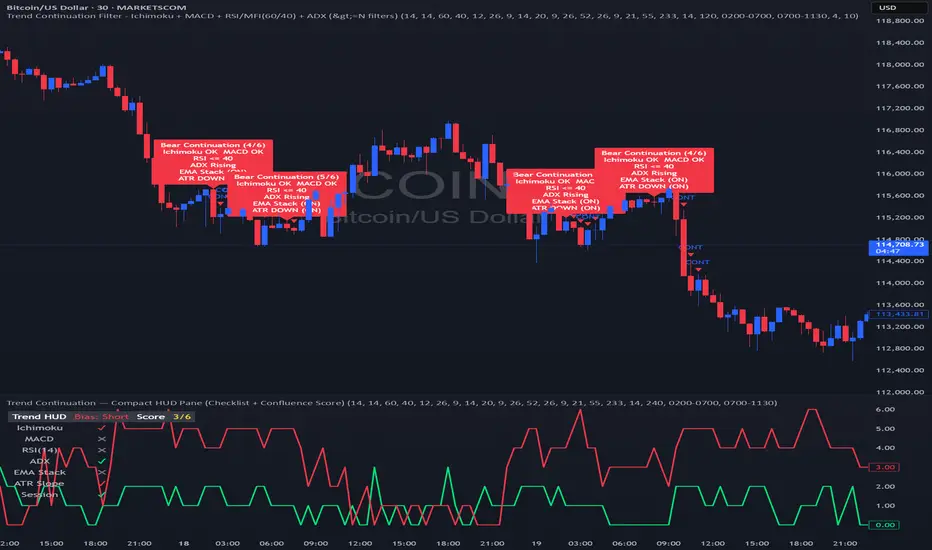
🖥️ Trend Continuation HUD Panel — Multi-Factor Dashboard
This panel is your trend continuation command center ⚡. Instead of guessing which filters are in play, the HUD shows you a real-time checklist of up to 6 confluence filters — with clear ✔ and ✖ signals.
🔍 What it shows
Each row = one filter. Green ✔ means it’s passing in the trend direction, red ✖ means it’s failing, grey ✖ means neutral/inactive.
✔ Ichimoku (9/26/52/26) → Above/Below cloud + Tenkan/Kijun order
✔ MACD (12/26/9) → Histogram slope & zero-line alignment
✔ RSI / MFI (14) → Momentum ≥60 bull / ≤40 bear
✔ ADX (14) → Strength ≥20 and rising
✔ EMA Alignment (9/21/55/233) (optional) → Stack order confirms trend engine
✔ ATR Slope (14) (optional) → Expanding volatility filter
📊 Score Line (0–6 scale)
At the bottom of the HUD you’ll see a colored score plot:
🟢 5–6 = A-Grade Trend Environment → strongest continuation regimes
🟡 3–4 = Mixed Bag → wait for clarity
🔴 0–2 = Fail Zone → stay flat, no trend support
🎯 How to use it
Scan the HUD first → wait until Score ≥5 and most rows are ✔ green.
Then check Overlay labels/arrows → only take signals while HUD is green (trend environment confirmed).
Adjust strictness with minChecks:
• Normal Days → Score ≥4 acceptable (partial TP style).
• Trend Days → Demand Score ≥5 (stacked, high-conviction runs).
🧩 Best Practices
⏰ Focus on London & NY sessions (HUD grays out off-hours).
🔄 Keep the HUD & Overlay in sync (same EMA/ATR/session settings).
⚡ Use the HUD as your filter, Overlay as your trigger → keeps you aligned with your trading plan and risk model.
受保護腳本
此腳本以閉源形式發佈。 不過,您可以自由且不受任何限制地使用它 — 在此處了解更多資訊。
免責聲明
這些資訊和出版物並不意味著也不構成TradingView提供或認可的金融、投資、交易或其他類型的意見或建議。請在使用條款閱讀更多資訊。
受保護腳本
此腳本以閉源形式發佈。 不過,您可以自由且不受任何限制地使用它 — 在此處了解更多資訊。
免責聲明
這些資訊和出版物並不意味著也不構成TradingView提供或認可的金融、投資、交易或其他類型的意見或建議。請在使用條款閱讀更多資訊。