PROTECTED SOURCE SCRIPT
Combined EMA + RSI + Stochastic RSI
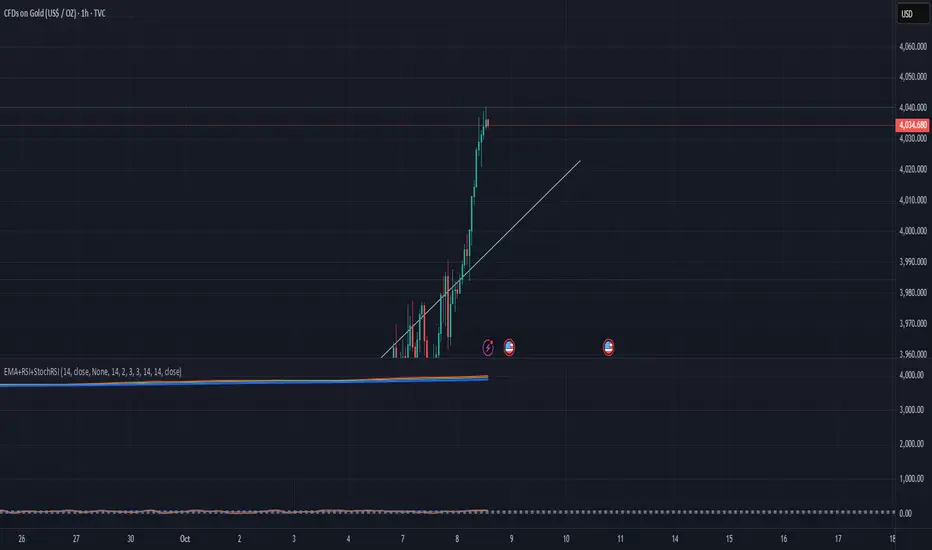
⚙️ Combined EMA + RSI + Stochastic RSI Indicator
This indicator merges three powerful technical tools — EMA, RSI, and Stochastic RSI — to help traders identify trend direction, strength, and potential reversal zones all in one view.
EMA (Exponential Moving Average):
Shows the overall market trend. When price stays above the EMA, it signals bullish momentum; below the EMA indicates bearish pressure.
RSI (Relative Strength Index):
Measures momentum and overbought/oversold conditions, helping identify when a trend may be losing strength.
Stochastic RSI:
Adds a faster, more sensitive oscillator, giving early signals of potential reversals or pullbacks within the main trend.
受保護腳本
此腳本以閉源形式發佈。 不過,您可以自由且不受任何限制地使用它 — 在此處了解更多資訊。
免責聲明
這些資訊和出版物並不意味著也不構成TradingView提供或認可的金融、投資、交易或其他類型的意見或建議。請在使用條款閱讀更多資訊。
受保護腳本
此腳本以閉源形式發佈。 不過,您可以自由且不受任何限制地使用它 — 在此處了解更多資訊。
免責聲明
這些資訊和出版物並不意味著也不構成TradingView提供或認可的金融、投資、交易或其他類型的意見或建議。請在使用條款閱讀更多資訊。