PROTECTED SOURCE SCRIPT
Market Divergence (Line version) ©MBYLAB
Good morning.
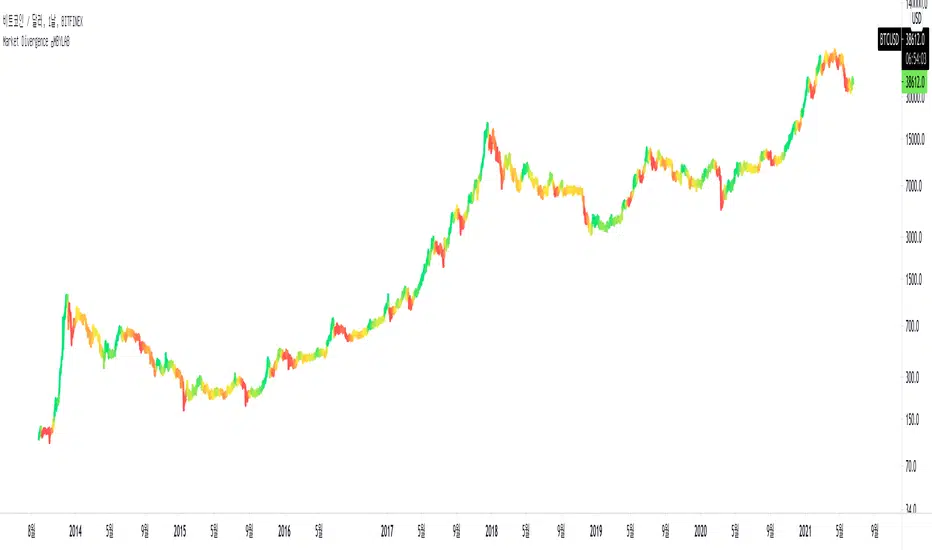
This indicator measures the distance between the moving average line and the current price position, so you can check the price divergence.
logic
In general, when the closing price breaks below the moving average and closes, it can be interpreted as downward divergence.
Based on the logic described above, this indicator will have a darker color as the current price position is further away from the set moving average.
When this indicator starts changing from red to yellow, it can be interpreted that the trend is reversing.(Bearish -> Bullish)
How to use
First, set the existing candle chart in the upper left to invisible and then apply the corresponding indicator.
Anyone can use this indicator, no special conditions are required.
受保護腳本
此腳本以閉源形式發佈。 不過,您可以自由使用,沒有任何限制 — 點擊此處了解更多。
Hi, im Quant from KR
免責聲明
這些資訊和出版物並非旨在提供,也不構成TradingView提供或認可的任何形式的財務、投資、交易或其他類型的建議或推薦。請閱讀使用條款以了解更多資訊。
免責聲明
這些資訊和出版物並非旨在提供,也不構成TradingView提供或認可的任何形式的財務、投資、交易或其他類型的建議或推薦。請閱讀使用條款以了解更多資訊。