PROTECTED SOURCE SCRIPT
Sideways Market Detector 5min & 15min --LANS
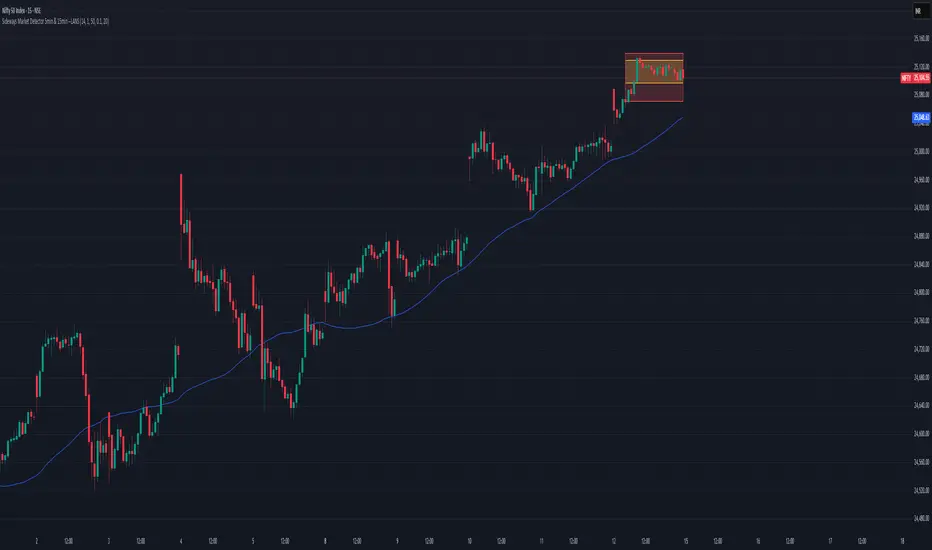
Sideways Market Detector (5min & 15min) — LANS
This indicator is designed to detect sideways (range-bound) market conditions across two key intraday timeframes — 5-minute and 15-minute charts — and visually highlight them for better decision-making.
🔑 Key Features
Dual Timeframe Detection – Analyzes both 5-min and 15-min candles simultaneously.
ATR-Based Volatility Filter – Confirms sideways action using low volatility periods relative to ATR (Average True Range).
SMA Slope Filter – Ensures sideways detection by measuring flatness of SMA (Simple Moving Average) slope.
Dynamic Range Boxes – Automatically draws boxes showing the high-low range during sideways periods:
🟨 Yellow box → Sideways detected on 5-min
🟥 Red box → Sideways detected on 15-min
Customizable Inputs – ATR length, multiplier, SMA length, slope threshold, and lookback period are fully adjustable.
Built-in Alerts – Receive alerts when sideways market conditions are detected for either timeframe.
📊 How to Use
1. Identify Consolidation Zones – Use the plotted boxes to spot consolidation areas and potential breakout zones.
2. Plan Trades – Wait for price to break above/below the sideways range for potential continuation or reversal trades.
3. Adjust Parameters – Tune ATR multiplier and SMA slope threshold based on instrument volatility and trading style.
This tool is ideal for scalpers, intraday traders, and breakout traders looking to avoid chop and focus on trending moves after consolidation.
受保護腳本
此腳本以閉源形式發佈。 不過,您可以自由且不受任何限制地使用它 — 在此處了解更多資訊。
免責聲明
這些資訊和出版物並不意味著也不構成TradingView提供或認可的金融、投資、交易或其他類型的意見或建議。請在使用條款閱讀更多資訊。
受保護腳本
此腳本以閉源形式發佈。 不過,您可以自由且不受任何限制地使用它 — 在此處了解更多資訊。
免責聲明
這些資訊和出版物並不意味著也不構成TradingView提供或認可的金融、投資、交易或其他類型的意見或建議。請在使用條款閱讀更多資訊。