OPEN-SOURCE SCRIPT
已更新 Candle Scale Comparison
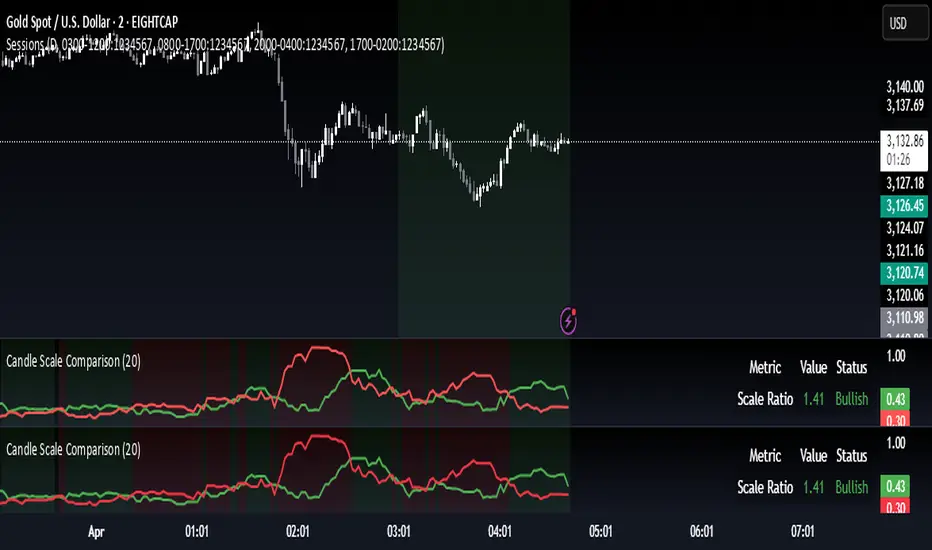
Compares the scale of bullish and bearish candles and shows which side is currently dominant. Works in any symbol.
1. Input Parameters:
- LookbackPeriod: Allows you to set how many bars to look back for calculating averages (default: 20)
- showLabels: Toggle to show/hide dominance labels on the chart
2. Calculations:
- Calculates the scale of bullish candles (close - open)
Calculates the scale of bearish candles (open - close)
- Computes moving averages for both scales using the specified lookback period
- Determines which type of candles are dominating based on the averages
3. Visual Elements:
- Plots two lines showing the average scales:
- Green line for bullish candle scales
- Red line for bearish candle scales
- Adds a background color that changes based on dominance:
- Light green when bullish candles dominate
- Light red when bearish candles dominate
- Shows labels above the chart indicating current dominance
- Displays a table in the top-right corner showing:
- The current scale ratio (bullish/bearish)
- The current dominance status
4. Features:
- The indicator is plotted in a separate pane below the main chart
- Uses color coding for easy visual interpretation
- Provides both visual and numerical representation of the dominance
- Updates in real-time as new candles form
發行說明
Compares the scale of bullish and bearish candles and shows which side is currently dominant. Works in any symbol.1. Input Parameters:
- LookbackPeriod: Allows you to set how many bars to look back for calculating averages (default: 20)
- showLabels: Toggle to show/hide dominance labels on the chart
2. Calculations:
- Calculates the scale of bullish candles (close - open)
Calculates the scale of bearish candles (open - close)
- Computes moving averages for both scales using the specified lookback period
- Determines which type of candles are dominating based on the averages
3. Visual Elements:
- Plots two lines showing the average scales:
- Green line for bullish candle scales
- Red line for bearish candle scales
- Adds a background color that changes based on dominance:
- Light green when bullish candles dominate
- Light red when bearish candles dominate
- Shows labels above the chart indicating current dominance
- Displays a table in the top-right corner showing:
- The current scale ratio (bullish/bearish)
- The current dominance status
4. Features:
- The indicator is plotted in a separate pane below the main chart
- Uses color coding for easy visual interpretation
- Provides both visual and numerical representation of the dominance
- Updates in real-time as new candles form
開源腳本
秉持TradingView一貫精神,這個腳本的創作者將其設為開源,以便交易者檢視並驗證其功能。向作者致敬!您可以免費使用此腳本,但請注意,重新發佈代碼需遵守我們的社群規範。
免責聲明
這些資訊和出版物並非旨在提供,也不構成TradingView提供或認可的任何形式的財務、投資、交易或其他類型的建議或推薦。請閱讀使用條款以了解更多資訊。
開源腳本
秉持TradingView一貫精神,這個腳本的創作者將其設為開源,以便交易者檢視並驗證其功能。向作者致敬!您可以免費使用此腳本,但請注意,重新發佈代碼需遵守我們的社群規範。
免責聲明
這些資訊和出版物並非旨在提供,也不構成TradingView提供或認可的任何形式的財務、投資、交易或其他類型的建議或推薦。請閱讀使用條款以了解更多資訊。