OPEN-SOURCE SCRIPT
Stock Highs Tracker with Indices
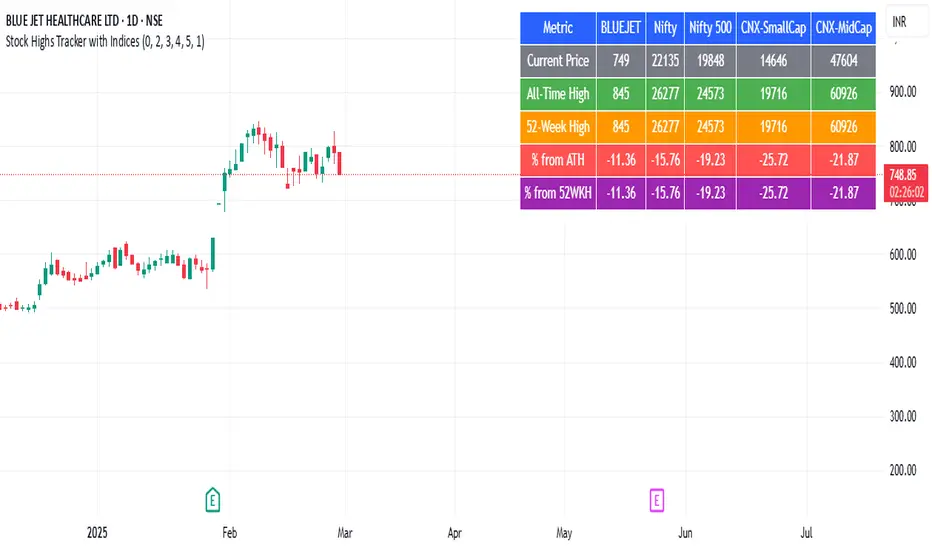
This Pine Script indicator tracks stock highs and compares them with major indices (Nifty, Nifty 500, CNX-SmallCap, and CNX-MidCap). Here’s what it does:
1. Retrieves and Displays Key Price Metrics
All-Time High (ATH): The highest price the stock has ever reached.
52-Week High: The highest price in the last 252 trading days.
Current Price: The stock’s closing price.
2. Calculates Percentage Differences
% from ATH: How much the stock is below its all-time high.
% from 52WKH: How much the stock is below its 52-week high.
3. Fetches and Compares with Indices
It retrieves similar metrics (ATH, 52-Week High, Current Price, % from ATH, % from 52WKH) for:
Nifty 50
Nifty 500
CNX-SmallCap
CNX-MidCap
This helps in assessing whether the stock's movement aligns with broader market trends.
4. Displays Data in a Table
The script creates a table positioned at the top-right corner.
It color-codes different rows for easy readability.
The table compares the stock’s performance against the major indices.
Use Case
Helps traders and investors track stock highs relative to market indices.
Identifies whether the stock is outperforming or underperforming the broader market.
開源腳本
In true TradingView spirit, the creator of this script has made it open-source, so that traders can review and verify its functionality. Kudos to the author! While you can use it for free, remember that republishing the code is subject to our House Rules.
免責聲明
The information and publications are not meant to be, and do not constitute, financial, investment, trading, or other types of advice or recommendations supplied or endorsed by TradingView. Read more in the Terms of Use.