OPEN-SOURCE SCRIPT
[Mubeen] True Bar Volume
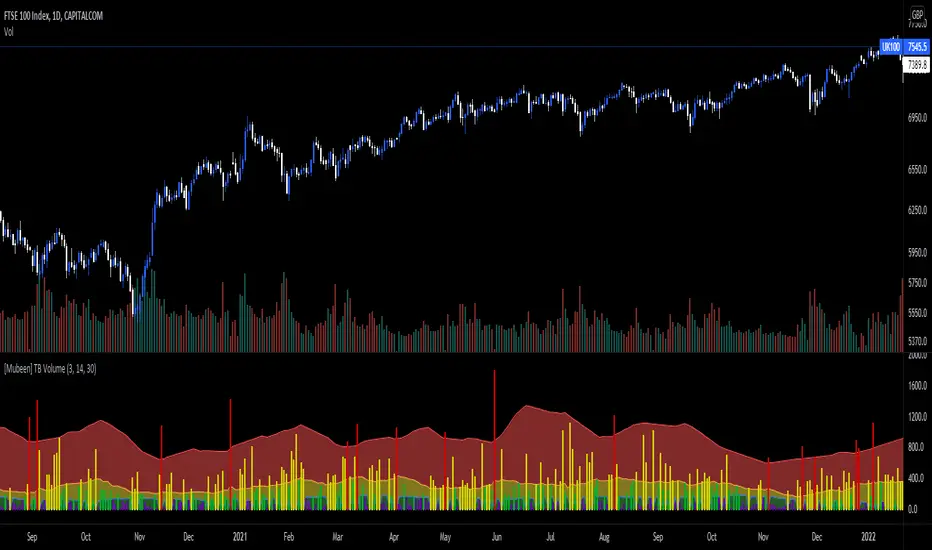
True Bar Volume, or TB Volume, is an indicator that measures the volume against the price action that has occurred.
Volume can sometimes be miss leading as it does not necessary show whether it had an impact on the price of the underlying, as one individual (represented as one volume) who has put $100 into the underlying can impact the underlying the same as hundred individuals (represented as hundred volume) putting $1 into the underlying: but the volume will widely differ and can cause confusion for outsiders. With the True Bar indicator, it aims to show abnormal behaviour in the price change against the amount of volume that was stated. It visualises the effect of the volume on the underlying by colour coding the different levels of True Bar results, divided into Red, Yellow, Green, Purple.
Red indicates that the price has changed way out of portion compared with the volume that was seen. It is compared against the highest TB Volume values through selected periods and once the volume as broken out of the high, it is considered an anomaly.
Yellow indicates that the TB Volume values are representing the mean values so it is considered as normal trading activity. Spikes in yellow values can also be seen as rise in high interest in the underlying.
Green indicates that the TB Volume values are under performing in market activity.
Purple indicates that is it a null result as investors might be looking for a better entry into a market, or seen as interest is low in the market.
TB Volume should not be used on it's own as it only gives a reporting measurement of the volume performance, which may be meaningless without the supplementation of other indicators.
開源腳本
本著TradingView的真正精神,此腳本的創建者將其開源,以便交易者可以查看和驗證其功能。向作者致敬!雖然您可以免費使用它,但請記住,重新發佈程式碼必須遵守我們的網站規則。
免責聲明
這些資訊和出版物並不意味著也不構成TradingView提供或認可的金融、投資、交易或其他類型的意見或建議。請在使用條款閱讀更多資訊。
開源腳本
本著TradingView的真正精神,此腳本的創建者將其開源,以便交易者可以查看和驗證其功能。向作者致敬!雖然您可以免費使用它,但請記住,重新發佈程式碼必須遵守我們的網站規則。
免責聲明
這些資訊和出版物並不意味著也不構成TradingView提供或認可的金融、投資、交易或其他類型的意見或建議。請在使用條款閱讀更多資訊。