OPEN-SOURCE SCRIPT
已更新 Sessions Rainbow EST with overlaps
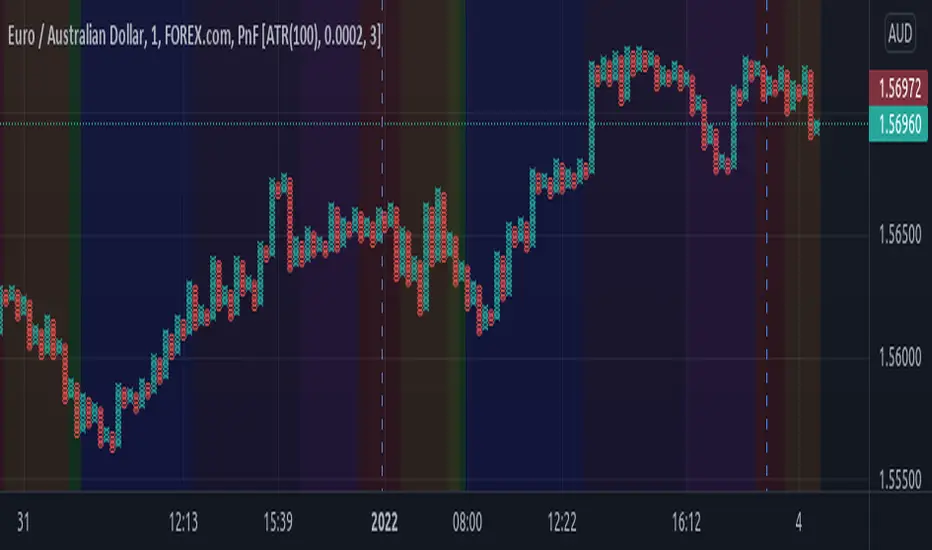
This script displays the trading zones with overlaps based on the color of the rainbow. It is used with a Point&Figure chart to show trends associated with trading periods and overlapping trading periods.
發行說明
Reordered so that Sydney starts the daily rainbow session with red, ending with New York as violet.開源腳本
秉持TradingView一貫精神,這個腳本的創作者將其設為開源,以便交易者檢視並驗證其功能。向作者致敬!您可以免費使用此腳本,但請注意,重新發佈代碼需遵守我們的社群規範。
免責聲明
這些資訊和出版物並非旨在提供,也不構成TradingView提供或認可的任何形式的財務、投資、交易或其他類型的建議或推薦。請閱讀使用條款以了解更多資訊。
免責聲明
這些資訊和出版物並非旨在提供,也不構成TradingView提供或認可的任何形式的財務、投資、交易或其他類型的建議或推薦。請閱讀使用條款以了解更多資訊。