OPEN-SOURCE SCRIPT
已更新 Bionic -- Expected Weekly Levels (Public)
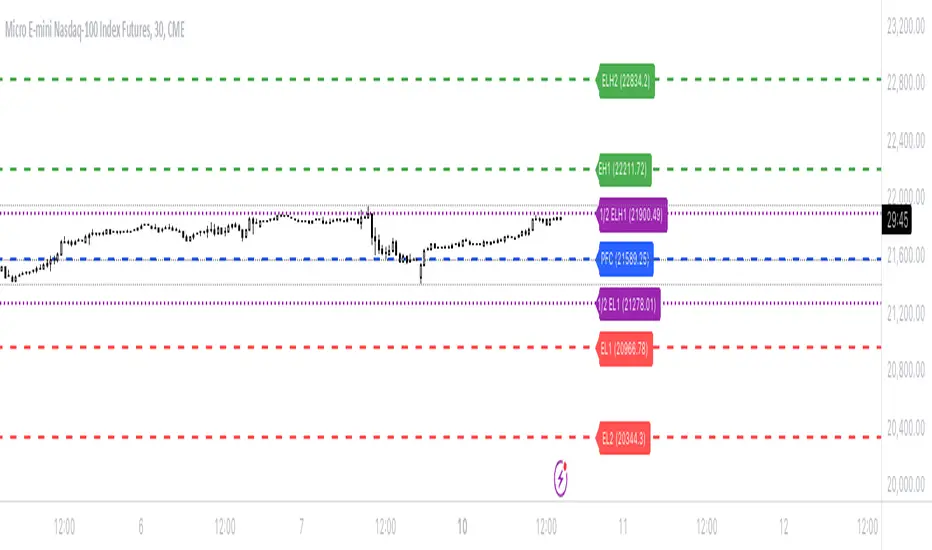
This script will draw lines for Expected Weekly Levels based upon Previous Friday Close, Implied Volatility (EOD Friday), and the square root of Days to Expire (always 7) / 365.
Script will draw 2 high and low levels:
*1st levels are 1 standard deviation from the Previous Friday Close.
* 2nd levels are 2 standard deviation from the Previous Friday Close.
There are also a 1/2 Low and 1/2 Low 1st level. These are 1/2 a standard deviation and act more as a point of interest level. 1/2 levels have 34% probability.
Configurations:
* All lines styles are individually configurable
* All lines can individually be turned on/off
* Text for all lines can be changed
* Global config allows for the
* Lines to show the price on the label
* Lines to have text in the label
* Hide or show all labels
* Lines offset from price is configurable
* Label size is configurable
發行說明
* Added individual Implied Volatility inputs for Calls/Longs and Puts/Short* IV may be different between Calls and Puts based upon overall market sentiment
* Allows greater precision and flexibility for the end user
* The same values can be used in both input if desired.
發行說明
Updated calculation from 365 days to 252 days. Industry standard when calculated values is 252 (the number of trading days in a year) and NOT 365 (number of calendar days in a year).
Also updated the default input for the Previous Friday close to be 0.0.
發行說明
* Made days available for trading configurable. Deafult is 365 days (total days in calendar year) and other options commonly used is 252 days (number of trading days in a calendar year).
++++ User now has ability to choose number of days for calcualtion.
+ Changed default line from Dashed to Solid
發行說明
Updated script to include 3 standard deviations, i.e. a 3rd Level low & high. 發行說明
Fixed bug with 3rd level deviation calculation開源腳本
秉持TradingView一貫精神,這個腳本的創作者將其設為開源,以便交易者檢視並驗證其功能。向作者致敬!您可以免費使用此腳本,但請注意,重新發佈代碼需遵守我們的社群規範。
免責聲明
這些資訊和出版物並非旨在提供,也不構成TradingView提供或認可的任何形式的財務、投資、交易或其他類型的建議或推薦。請閱讀使用條款以了解更多資訊。
開源腳本
秉持TradingView一貫精神,這個腳本的創作者將其設為開源,以便交易者檢視並驗證其功能。向作者致敬!您可以免費使用此腳本,但請注意,重新發佈代碼需遵守我們的社群規範。
免責聲明
這些資訊和出版物並非旨在提供,也不構成TradingView提供或認可的任何形式的財務、投資、交易或其他類型的建議或推薦。請閱讀使用條款以了解更多資訊。