PROTECTED SOURCE SCRIPT
已更新 UO Cross
This particular UO Cross is evolved into far more flexible and visually intuitive oscillator than previous versions.
After thorough experiments with the code of indicator, I came to new deductions on how to use it properly for random TF and made it simpler.
How to read a chart using UOX:
With this indicator we can understand:
It would be much better if you combine it with volume-based indicators.
Good luck!
After thorough experiments with the code of indicator, I came to new deductions on how to use it properly for random TF and made it simpler.
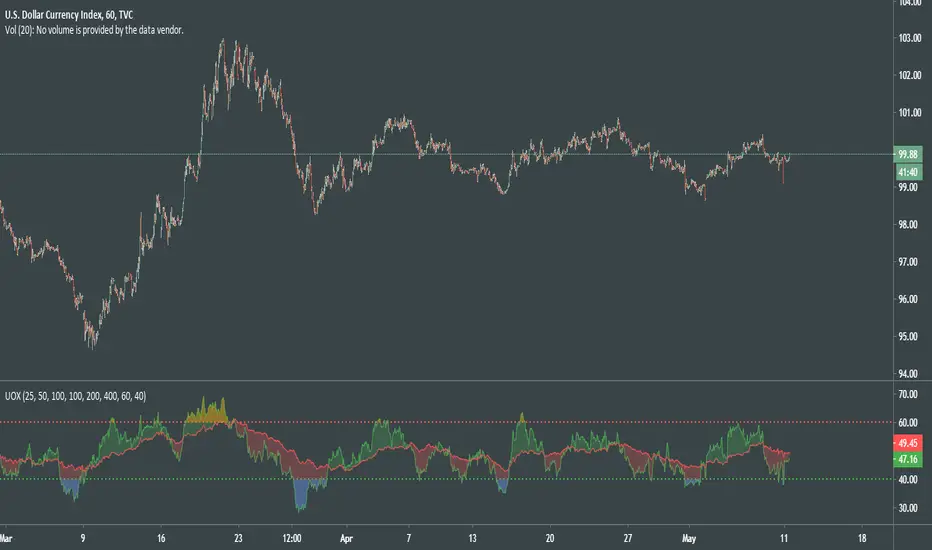
How to read a chart using UOX:
- Before uptrend takes place, we see the both indicator levels moving towards green dotted line (40).
- When green UO index passes below 40, it's an alert that the market is about to interact to new demand levels, coloring it blue for a potential reversal.
- Once green UO index is moving up and crossing above green dotted line - the second signal of uptrend established.
- Another strong sign of uptrend is when green UO index passes above red UO index, coloring the space in between 2 indicators greenish.
- At this point of time, we can be more confident that the general movement of the price is headed upwards, although we might see some small corrections there.
- During uptrend Green UO index will fluctuate above red UO index.
- Both indices will rise, getting closer and closer to red dotted line, which psychologically would be the first signs of the reversal of the uptrend.
- When you see green UO index passing above red dotted line 60, coloring orangish, that's a serious alert for upcoming reversal.
- I'll once more remind you that at this point of time both UO indices are at overbought levels, def above 50.
- You know the situation is serious when you witness red UO index being very close to red dotted line!
- To confirm the signals for downtrend, you must see green UO index go down and passing below red dotted line.
- Second confirmation of downtrend is when green UO index crosses below red UO index, and colors the space in between indices red.
With this indicator we can understand:
- Condition of the market
- Early signs and alerts for reversal
- Signals of entry
- Confirmations of those signals
- Visualized mass psychology behind domination of bulls / bears
It would be much better if you combine it with volume-based indicators.
Good luck!
發行說明
Few bug fixes受保護腳本
此腳本以閉源形式發佈。 不過,您可以自由使用,沒有任何限制 — 點擊此處了解更多。
Unlock exclusive tools: fractlab.com
ᴀʟʟ ᴄᴏɴᴛᴇɴᴛ ᴘʀᴏᴠɪᴅᴇᴅ ʙʏ ꜰʀᴀᴄᴛʟᴀʙ ɪꜱ ɪɴᴛᴇɴᴅᴇᴅ ꜰᴏʀ ɪɴꜰᴏʀᴍᴀᴛɪᴏɴᴀʟ ᴀɴᴅ ᴇᴅᴜᴄᴀᴛɪᴏɴᴀʟ ᴘᴜʀᴘᴏꜱᴇꜱ ᴏɴʟʏ.
ᴘᴀꜱᴛ ᴘᴇʀꜰᴏʀᴍᴀɴᴄᴇ ɪꜱ ɴᴏᴛ ɪɴᴅɪᴄᴀᴛɪᴠᴇ ᴏꜰ ꜰᴜᴛᴜʀᴇ ʀᴇꜱᴜʟᴛꜱ.
ᴀʟʟ ᴄᴏɴᴛᴇɴᴛ ᴘʀᴏᴠɪᴅᴇᴅ ʙʏ ꜰʀᴀᴄᴛʟᴀʙ ɪꜱ ɪɴᴛᴇɴᴅᴇᴅ ꜰᴏʀ ɪɴꜰᴏʀᴍᴀᴛɪᴏɴᴀʟ ᴀɴᴅ ᴇᴅᴜᴄᴀᴛɪᴏɴᴀʟ ᴘᴜʀᴘᴏꜱᴇꜱ ᴏɴʟʏ.
ᴘᴀꜱᴛ ᴘᴇʀꜰᴏʀᴍᴀɴᴄᴇ ɪꜱ ɴᴏᴛ ɪɴᴅɪᴄᴀᴛɪᴠᴇ ᴏꜰ ꜰᴜᴛᴜʀᴇ ʀᴇꜱᴜʟᴛꜱ.
免責聲明
這些資訊和出版物並非旨在提供,也不構成TradingView提供或認可的任何形式的財務、投資、交易或其他類型的建議或推薦。請閱讀使用條款以了解更多資訊。
受保護腳本
此腳本以閉源形式發佈。 不過,您可以自由使用,沒有任何限制 — 點擊此處了解更多。
Unlock exclusive tools: fractlab.com
ᴀʟʟ ᴄᴏɴᴛᴇɴᴛ ᴘʀᴏᴠɪᴅᴇᴅ ʙʏ ꜰʀᴀᴄᴛʟᴀʙ ɪꜱ ɪɴᴛᴇɴᴅᴇᴅ ꜰᴏʀ ɪɴꜰᴏʀᴍᴀᴛɪᴏɴᴀʟ ᴀɴᴅ ᴇᴅᴜᴄᴀᴛɪᴏɴᴀʟ ᴘᴜʀᴘᴏꜱᴇꜱ ᴏɴʟʏ.
ᴘᴀꜱᴛ ᴘᴇʀꜰᴏʀᴍᴀɴᴄᴇ ɪꜱ ɴᴏᴛ ɪɴᴅɪᴄᴀᴛɪᴠᴇ ᴏꜰ ꜰᴜᴛᴜʀᴇ ʀᴇꜱᴜʟᴛꜱ.
ᴀʟʟ ᴄᴏɴᴛᴇɴᴛ ᴘʀᴏᴠɪᴅᴇᴅ ʙʏ ꜰʀᴀᴄᴛʟᴀʙ ɪꜱ ɪɴᴛᴇɴᴅᴇᴅ ꜰᴏʀ ɪɴꜰᴏʀᴍᴀᴛɪᴏɴᴀʟ ᴀɴᴅ ᴇᴅᴜᴄᴀᴛɪᴏɴᴀʟ ᴘᴜʀᴘᴏꜱᴇꜱ ᴏɴʟʏ.
ᴘᴀꜱᴛ ᴘᴇʀꜰᴏʀᴍᴀɴᴄᴇ ɪꜱ ɴᴏᴛ ɪɴᴅɪᴄᴀᴛɪᴠᴇ ᴏꜰ ꜰᴜᴛᴜʀᴇ ʀᴇꜱᴜʟᴛꜱ.
免責聲明
這些資訊和出版物並非旨在提供,也不構成TradingView提供或認可的任何形式的財務、投資、交易或其他類型的建議或推薦。請閱讀使用條款以了解更多資訊。