TSLA Reversal Alert: Harmonic + VWAP + RSI DivergenceWorking on a Bearish Harmonic Alert, and Bullish Harmonic Alert
Alert

TitanGrid L/S SuperEngineTitanGrid L/S SuperEngine
Experimental Trend-Aligned Grid Signal Engine for Long & Short Execution
🔹 Overview
TitanGrid is an advanced, real-time signal engine built around a tactical grid structure.
It manages Long and Short trades using trend-aligned entries, layered scaling, and partial exits.
Unlike traditional strategy() -based scripts, TitanGrid runs as an indicator() , but includes its own full internal simulation engine.
This allows it to track capital, equity, PnL, risk exposure, and trade performance bar-by-bar — effectively simulating a custom backtest, while remaining compatible with real-time alert-based execution systems.
The concept was born from the fusion of two prior systems:
Assassin’s Grid (grid-based execution and structure) + Super 8 (trend-filtering, smart capital logic), both developed under the AssassinsGrid framework.
🔹 Disclaimer
This is an experimental tool intended for research, testing, and educational use.
It does not provide guaranteed outcomes and should not be interpreted as financial advice.
Use with demo or simulated accounts before considering live deployment.
🔹 Execution Logic
Trend direction is filtered through a custom SuperTrend engine. Once confirmed:
• Long entries trigger on pullbacks, exiting progressively as price moves up
• Short entries trigger on rallies, exiting as price declines
Grid levels are spaced by configurable percentage width, and entries scale dynamically.
🔹 Stop Loss Mechanism
TitanGrid uses a dual-layer stop system:
• A static stop per entry, placed at a fixed percentage distance matching the grid width
• A trend reversal exit that closes the entire position if price crosses the SuperTrend in the opposite direction
Stops are triggered once per cycle, ensuring predictable and capital-aware behavior.
🔹 Key Features
• Dual-side grid logic (Long-only, Short-only, or Both)
• SuperTrend filtering to enforce directional bias
• Adjustable grid spacing, scaling, and sizing
• Static and dynamic stop-loss logic
• Partial exits and reset conditions
• Webhook-ready alerts (browser-based automation compatible)
• Internal simulation of equity, PnL, fees, and liquidation levels
• Real-time dashboard for full transparency
🔹 Best Use Cases
TitanGrid performs best in structured or mean-reverting environments.
It is especially well-suited to assets with the behavioral profile of ETH — reactive, trend-intraday, and prone to clean pullback formations.
While adaptable to multiple timeframes, it shows strongest performance on the 15-minute chart , offering a balance of signal frequency and directional clarity.
🔹 License
Published under the Mozilla Public License 2.0 .
You are free to study, adapt, and extend this script.
🔹 Panel Reference
The real-time dashboard displays performance metrics, capital state, and position behavior:
• Asset Type – Automatically detects the instrument class (e.g., Crypto, Stock, Forex) from symbol metadata
• Equity – Total simulated capital: realized PnL + floating PnL + remaining cash
• Available Cash – Capital not currently allocated to any position
• Used Margin – Capital locked in open trades, based on position size and leverage
• Net Profit – Realized gain/loss after commissions and fees
• Raw Net Profit – Gross result before trading costs
• Floating PnL – Unrealized profit or loss from active positions
• ROI – Return on initial capital, including realized and floating PnL. Leverage directly impacts this metric, amplifying both gains and losses relative to account size.
• Long/Short Size & Avg Price – Open position sizes and volume-weighted average entry prices
• Leverage & Liquidation – Simulated effective leverage and projected liquidation level
• Hold – Best-performing hold side (Long or Short) over the session
• Hold Efficiency – Performance efficiency during holding phases, relative to capital used
• Profit Factor – Ratio of gross profits to gross losses (realized)
• Payoff Ratio – Average profit per win / average loss per loss
• Win Rate – Percent of profitable closes (including partial exits)
• Expectancy – Net average result per closed trade
• Max Drawdown – Largest recorded drop in equity during the session
• Commission Paid – Simulated trading costs: maker, taker, funding
• Long / Short Trades – Count of entry signals per side
• Time Trading – Number of bars spent in active positions
• Volume / Month – Extrapolated 30-day trading volume estimate
• Min Capital – Lowest equity level recorded during the session
🔹 Reference Ranges by Strategy Type
Use the following metrics as reference depending on the trading style:
Grid / Mean Reversion
• Profit Factor: 1.2 – 2.0
• Payoff Ratio: 0.5 – 1.2
• Win Rate: 50% – 70% (based on partial exits)
• Expectancy: 0.05% – 0.25%
• Drawdown: Moderate to high
• Commission Impact: High
Trend-Following
• Profit Factor: 1.5 – 3.0
• Payoff Ratio: 1.5 – 3.5
• Win Rate: 30% – 50%
• Expectancy: 0.3% – 1.0%
• Drawdown: Low to moderate
Scalping / High-Frequency
• Profit Factor: 1.1 – 1.6
• Payoff Ratio: 0.3 – 0.8
• Win Rate: 80% – 95%
• Expectancy: 0.01% – 0.05%
• Volume / Month: Very high
Breakout Strategies
• Profit Factor: 1.4 – 2.2
• Payoff Ratio: 1.2 – 2.0
• Win Rate: 35% – 60%
• Expectancy: 0.2% – 0.6%
• Drawdown: Can be sharp after failed breakouts
🔹 Note on Performance Simulation
TitanGrid includes internal accounting of fees, slippage, and funding costs.
While its logic is designed for precision and capital efficiency, performance is naturally affected by exchange commissions.
In frictionless environments (e.g., zero-fee simulation), its high-frequency logic could — in theory — extract substantial micro-edges from the market.
However, real-world conditions introduce limits, and all results should be interpreted accordingly.

Watchlist AlertThis “Watchlist Alert” indicator is to help traders monitor multiple symbols and notify them whenever a specified target price is reached. Upon loading the script, you can define up to ten ticker symbols along with their individual price targets. The script stores these pairs in a persistent map so that, on each new bar, it retrieves the previous and current close prices for every symbol in your watchlist. If a symbol’s price crosses above or below its target, the script sends an alert (using your chosen alert frequency) and records the timestamp of that event.
Visually, the indicator displays a small table at the top center of your chart. For each watched symbol, it shows four columns: the symbol name, its latest close price (in the chart’s timeframe), the target price you set, and the last time an alert was emitted (formatted as MM.dd HH:mm:ss). By comparing the previous close to the current close and checking against the stored “lastAlertTime,” the script ensures that you receive exactly one alert per crossing event per bar.
In short, the key features are:
Input up to ten symbols with their corresponding float price targets.
Automatically check each symbol’s previous and current close values every bar.
Trigger a single alert when price crosses a target—either upward or downward.
Maintain a map of last alert timestamps to prevent duplicate notifications.
Display a real-time table listing each symbol’s current price, target, and last alert time.
Whenever you need to keep tabs on multiple instruments across different timeframes without manually tracking price levels, simply add this indicator to your chart. It runs in the background and pushes alerts as soon as any watched symbol touches its defined threshold.

Auto AI Trendlines [TradingFinder] Clustering & Filtering Trends🔵 Introduction
Auto AI trendlines Clustering & Filtering Trends Indicator, draws a variety of trendlines. This auto plotting trendline indicator plots precise trendlines and regression lines, capturing trend dynamics.
Trendline trading is the strongest strategy in the financial market.
Regression lines, unlike trendlines, use statistical fitting to smooth price data, revealing trend slopes. Trendlines connect confirmed pivots, ensuring structural accuracy. Regression lines adapt dynamically.
The indicator’s ascending trendlines mark bullish pivots, while descending ones signal bearish trends. Regression lines extend in steps, reflecting momentum shifts. As the trend is your friend, this tool aligns traders with market flow.
Pivot-based trendlines remain fixed once confirmed, offering reliable support and resistance zones. Regression lines, adjusting to price changes, highlight short-term trend paths. Both are vital for traders across asset classes.
🔵 How to Use
There are four line types that are seen in the image below; Precise uptrend (green) and downtrend (red) lines connect exact price extremes, while Pivot-based uptrend and downtrend lines use significant swing points, both remaining static once formed.
🟣 Precise Trendlines
Trendlines only form after pivot points are confirmed, ensuring reliability. This reduces false signals in choppy markets. Regression lines complement with real-time updates.
The indicator always draws two precise trendlines on confirmed pivot points, one ascending and one descending. These are colored distinctly to mark bullish and bearish trends. They remain fixed, serving as structural anchors.
🟣 Dynamic Regression Lines
Regression lines, adjusting dynamically with price, reflect the latest trend slope for real-time analysis. Use these to identify trend direction and potential reversals.
Regression lines, updated dynamically, reflect real-time price trends and extend in steps. Ascending lines are green, descending ones orange, with shades differing from trendlines. This aids visual distinction.
🟣 Bearish Chart
A Bullish State emerges when uptrend lines outweigh or match downtrend lines, with recent upward momentum signaling a potential rise. Check the trend count in the state table to confirm, using it to plan long positions.
🟣 Bullish Chart
A Bearish State is indicated when downtrend lines dominate or equal uptrend lines, with recent downward moves suggesting a potential drop. Review the state table’s trend count to verify, guiding short position entries. The indicator reflects this shift for strategic planning.
🟣 Alarm
Set alerts for state changes to stay informed of Bullish or Bearish shifts without constant monitoring. For example, a transition to Bullish State may signal a buying opportunity. Toggle alerts On or Off in the settings.
🟣 Market Status
A table summarizes the chart’s status, showing counts of ascending and descending lines. This real-time overview simplifies trend monitoring. Check it to assess market bias instantly.
Monitor the table to track line counts and trend dominance.
A higher count of ascending lines suggests bullish bias. This helps traders align with the prevailing trend.
🔵 Settings
Number of Trendlines : Sets total lines (max 10, min 3), balancing chart clarity and trend coverage.
Max Look Back : Defines historical bars (min 50) for pivot detection, ensuring robust trendlines.
Pivot Range : Sets pivot sensitivity (min 2), adjusting trendline precision to market volatility.
Show Table Checkbox : Toggles display of a table showing ascending/descending line counts.
Alarm : Enable or Disable the alert.
🔵 Conclusion
The multi slopes indicator, blending pivot-based trendlines and dynamic regression lines, maps market trends with precision. Its dual approach captures both structural and short-term momentum.
Customizable settings, like trendline count and pivot range, adapt to diverse trading styles. The real-time table simplifies trend monitoring, enhancing efficiency. It suits forex, stocks, and crypto markets.
While trendlines anchor long-term trends, regression lines track intraday shifts, offering versatility. Contextual analysis, like price action, boosts signal reliability. This indicator empowers data-driven trading decisions.

Bollinger Bands - Multi Symbol Alert (Miu)This script extends the classic Bollinger Bands indicator with support for up to 8 user-defined symbols and a unique alert system.
Unlike traditional Bollinger Band indicators, it allows traders to configure alerts across multiple assets without keeping the indicator visible on the chart, making it ideal for passive multi-asset monitoring.
What it does:
This script calculates Bollinger Bands using a 100-period simple moving average and a standard deviation multiplier of 3 (or any input you set in the settings panel).
For each selected symbol, the upper and lower bands are retrieved using request.security() and monitored for breakouts.
Alerts are triggered when the closing price of the selected symbol breaks above the upper band (Overbought) or below the lower band (Oversold) — at the bar close.
How to use it:
1) Add the indicator to your chart.
2) Open the settings panel.
3) Select up to 8 symbols to monitor.
4) After setting parameters, click the three dots next to the indicator title and choose "Add Alert on...".
5) Name your alert and confirm.
6) If you don’t wish to keep the indicator visible, you can remove it from the chart — alerts will still function as expected.
Alert message includes:
- Symbol name (e.g., BTC, ETH, LTC)
- (OB) for overbought or (OS) for oversold
- Symbol’s price at the alert moment
Technical note:
This script uses request.security() to fetch Bollinger Band levels and closing prices from up to 8 selected symbols in real time.
Feel free to leave your feedback or suggestions in the comments section below.
Enjoy!
WebhookGeneratorLibrary "WebhookGenerator"
Generates Json objects for webhook messages.
GenerateOT(license_id, symbol, action, order_type, trade_type, size, price, tp, sl, risk, trailPrice, trailOffset)
CreateOrderTicket: Establishes a order ticket.
Parameters:
license_id (string) : Provide your license index
symbol (string) : Symbol on which to execute the trade
action (string) : Execution method of the trade : "MRKT" or "PENDING"
order_type (string) : Direction type of the order: "BUY" or "SELL"
trade_type (string) : Is it a "SPREAD" trade or a "SINGLE" symbol execution?
size (float) : Size of the trade, in units
price (float) : If the order is pending you must specify the execution price
tp (float) : (Optional) Take profit of the order
sl (float) : (Optional) Stop loss of the order
risk (float) : Percent to risk for the trade, if size not specified
trailPrice (float) : (Optional) Price at which trailing stop is starting
trailOffset (float) : (Optional) Amount to trail by
Returns: Return Order string

alert_formatLibrary "alert_format"
library to call alert with parameters specified
alert_format(message, param_names, param_values, params_format, freq)
alert with named parameters message
Parameters:
message (string) : message header that prefixes named parameters
param_names (array) : names for parameters specified in param_values
param_values (array) : values for parameters specified in param_names
params_format (string) : format for all param values, 2 decimals by default
freq (string) : Determines the allowed frequency of the alert trigger (see alert). alert.freq_once_per_bar_close by default
Cumulative Price Change AlertCumulative Price Change Alert
Version: 1.0
Author: QCodeTrader 🚀
Overview 🔍
The Cumulative Price Change Alert indicator analyzes the percentage change between the current and previous open prices and sums these changes over a user-defined number of bars. It then generates visual buy and sell signals using arrows and labels on the chart, helping traders spot cumulative price momentum and potential trading opportunities.
Key Features ⚙️
Customizable Timeframe 🕒:
Use a custom timeframe or default to the chart's timeframe for price data.
User-Defined Summation 🔢:
Specify the number of bars to sum, allowing you to analyze cumulative price changes.
Custom Buy & Sell Conditions 🔔:
Set individual percentage change thresholds and cumulative sum thresholds to tailor signals for
your strategy.
Visual Alerts 🚀:
Displays green upward arrows for buy signals and red downward arrows for sell signals directly
on the chart.
Informative Labels 📝:
Provides labels with formatted percentage change and cumulative sum details for the analyzed
bars.
Versatile Application 📊:
Suitable for stocks, forex, crypto, commodities, and more.
How It Works ⚡
Price Change Calculation ➗:
The indicator calculates the percentage change between the current bar's open price and the
previous bar's open price.
Cumulative Sum ➕:
It then sums these percentage changes over the last N bars (as specified by the user).
Signal Generation 🚦:
Buy Signal 🟢: When both the individual percentage change and the cumulative sum exceed
their respective buy thresholds, a green arrow and label are displayed.
Sell Signal 🔴: Conversely, if the individual change and cumulative sum fall below the sell
thresholds, a red arrow and label are shown.
How to Use 💡
Add the Indicator ➕:
Apply the indicator to your chart.
Customize Settings ⚙️:
Set a custom timeframe if desired.
Define the number of bars to sum.
Adjust the buy/sell percentage change and cumulative sum thresholds to match your trading
strategy.
Interpret Visual Cues 👀:
Monitor the chart for green or red arrows and corresponding labels that signal potential buy or
sell opportunities based on cumulative price movements.
Settings Explained 🛠️
Custom Timeframe:
Select an alternative timeframe for analysis, or leave empty to use the current chart's timeframe.
Number of Last Bars to Sum:
Determines how many bars are used to compute the cumulative percentage change.
Buy Condition - Min % Change:
The minimum individual percentage change required to consider a buy signal.
Buy Condition - Min Sum of Bars:
The minimum cumulative percentage change over the defined bars needed for a buy signal.
Sell Condition - Max % Change:
The maximum individual percentage change threshold for a sell signal.
Sell Condition - Max Sum of Bars:
The maximum cumulative percentage change over the defined bars for triggering a sell signal.
Best Use Cases 🎯
Momentum Identification 📈:
Quickly spot strong cumulative price movements and momentum shifts.
Entry/Exit Signals 🚪:
Use the visual signals to determine potential entry and exit points in your trading.
Versatile Strategy Application 🔄:
Effective for scalping, swing trading, and longer-term analysis across various markets.
UPD: uncheck labels for better performance

Time-based Alerts for Trading Windows🌟 Time-based Alerts for Trading Windows 🌐📈
This is a re-uploaded script as the previous one got hidden.
This Time-based Alerts for Trading Windows script is a highly customizable and reliable tool designed to assist traders in managing automated strategies or manually monitoring specific market conditions. Inspired by CrossTrade's Time-based Alert, this script is tailored for those who rely on precise time windows to trigger actions, such as sending webhook signals or managing Expert Advisors (EAs).
Whether you are a scalper, day trader, or algorithmic trader, this script empowers you to stay on top of your trades with fully customizable time-based alerts.
🛠️ Customizable Time Alerts
This indicator allows you to create up to 12 unique time windows by specifying the exact hour and minute for each alert. Each time window corresponds to an individual alert condition, making it perfect for managing trades during specific market sessions or key time periods.
For example:
Alert 1 can be set at 9:30 AM (market open).
Alert 2 can be set at 3:55 PM (just before market close).
Each alert can be toggled on or off in the indicator settings, allowing you to manage alerts without having to reconfigure your script.
You can adjust the colours to fit any colour scheme you like!
🕒 Odd and Even Time Alerts
The script comes with three built-in alert type categories:
Odd Alerts (marked with a green triangle on the chart): These correspond to odd-numbered inputs like Alert 1, Alert 3, Alert 5, and so on.
Even Alerts (marked with a red triangle on the chart): These correspond to even-numbered inputs like Alert 2, Alert 4, Alert 6, and so on.
You can also customize all 12 alerts individually to include a custom alert message
These alerts serve as a convenient way to differentiate between multiple trading strategies or market conditions. You can customize alert messages for odd and even alerts directly from TradingView’s alert panel.
🔗 Webhook Integration for Automation
This script is fully compatible with webhook-based automation. By configuring your alerts in TradingView, you can send signals to trading bots, EAs, or any third-party system. For example, you can:
Turn off an EA at a specific time (e.g., 3:55 PM EST).
Send buy/sell signals to your bot during predefined trading windows.
Simply use TradingView’s alert message editor to format webhook payloads for your automation system.
🌐 Timezone Flexibility
Trading happens across multiple time zones, and this script accounts for that. You can toggle between:
Eastern Time (New York): Ideal for most US-based markets.
Central Time (Exchange): Useful for futures and commodities traders.
This ensures your alerts are always in sync with your preferred time zone, eliminating confusion.
🎨 Visual Indicators
The script plots visual markers directly on your chart to indicate active alerts:
Up Facing Triangles: Represent odd-numbered alerts, providing a quick reference for these time windows.
Down Facing Triangles: Represent even-numbered alerts, helping you track different strategies or conditions.
These visual markers make it easy to see when alerts are triggered, even at a glance.
📈 Practical Use Case
Let’s say you’re trading the USTEC index on a 1-minute chart. You want to:
Turn off your trading bot at 16:55 EST to avoid after-market volatility.
Trigger a re-entry signal at 17:30 EST to capture moves during the Asian session.
Visually monitor these actions on your chart for easy reference.
This script makes it possible with precision alerts and webhook integration. Simply configure the time windows in the settings and set up your alerts in TradingView.
🚨 How to Set Up Alerts
Enable or Disable Alerts: Use the script’s settings to toggle specific alerts on or off as needed.
Set Custom Time Windows: Define the hour and minute for each alert in the settings panel.
Create Alerts in TradingView:
Go to the TradingView alert panel.
Select the condition (e.g., "Odd Time-based Alert (Green)" or "Even Time-based Alert (Red)").
Customize the alert message for webhook integration or personal notification.
Choose the trigger type: Once Per Bar or Once Per Bar Close to keep the alert active.
Integrate with Webhooks: Use the alert message field to format payloads for automation systems like MT4, MT5, or third-party bots.
📋 Key Notes
Alerts can trigger indefinitely if set to "Once Per Bar" or "Once Per Bar Close".
Always ensure the expiration date is set far in the future to avoid unexpected alert deactivation.
Test webhook messages and alert configurations thoroughly before using them in live trading.
This script is a powerful addition to your trading toolbox, offering precision, flexibility, and automation capabilities. Whether you’re turning off an EA, managing trades during market sessions, or automating strategies via webhooks, this script is here to support you.
Start using the Time-based Alerts for Trading Windows today and trade with confidence! 🚀✨

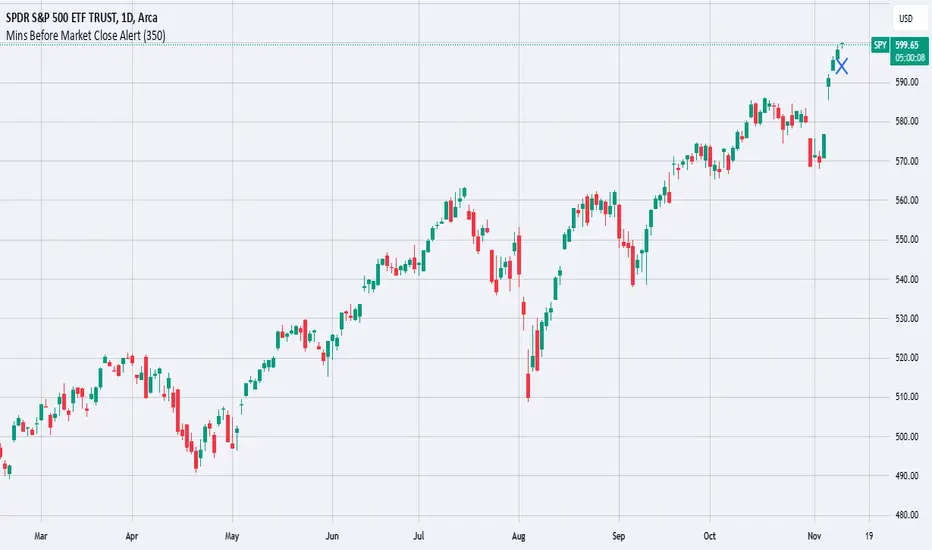
Mins Before Market Close AlertThis script will set an alert X mins before the market closes.
This is meant to be added to daily charts (calculations based off of daily bars).
This script can be useful for sending webhooks before the market closes to close open positions or to open new ones.
Simply add it to your daily chart and set up your desired alert (email, webhook, sound, etc.).
You can also change the chart marker to a different shape, color, or location to your preference.
Enjoy this simple alert!
Standard Deviation-Based Fibonacci Band by zdmre This indicator is designed to better understand market dynamics by focusing on standard deviation and the Fibonacci sequence. This indicator includes the following components to assist investors in analyzing price movements:
Weighted Moving Average (WMA) : The indicator creates a central band by utilizing the weighted moving average of standard deviation. WMA provides a more current and accurate representation by giving greater weight to recent prices. This central band offers insights into the general trend of the market, helping to identify potential buying and selling opportunities.
Fibonacci Bands : The Fibonacci bands located above and below the central band illustrate potential support and resistance levels for prices. These bands enable investors to pinpoint areas where the price may exhibit indecisiveness. When prices move within these bands, it may be challenging for investors to discern the market's preferred direction.
Indecisiveness Representation : When prices fluctuate between the Fibonacci bands, they may reflect a state of indecisiveness. This condition is critical for identifying potential reversal points and trend changes. Investors can evaluate these periods of indecisiveness to develop suitable buying and selling strategies.
This indicator is designed to assist investors in better analyzing market trends and supporting their decision-making processes. The integration of standard deviation and the Fibonacci sequence offers a new perspective on understanding market movements.
#DYOR

Outlier changes alertAn indicator that calculates click (price change), percentage change, and Z-score changes while displaying outliers based on defined ranges.
Outlier Detection:
Mark outliers (for price, percentage, Z-score) based on user-defined thresholds. For example, any price movement exceeding a certain Z-score or percentage change could be marked as an outlier and displayed on chart.
Indicator Overview:
1. Click (Price Change):
Calculate the absolute price change from one period to another (e.g., from the current closing price to the previous closing price).
2. Percentage Change:
Calculate the percentage price change over a specific period, showing how much the price has changed in relative terms compared to the previous price.
3. Z-Score:
Compute the Z-score to standardize the price change relative to its historical average and standard deviation. The Z-score helps in detecting whether a price movement is an outlier or falls within a normal range of volatility.

Harmonic Patterns Library [TradingFinder]🔵 Introduction
Harmonic patterns blend geometric shapes with Fibonacci numbers, making these numbers fundamental to understanding the patterns.
One person who has done a lot of research on harmonic patterns is Scott Carney.Scott Carney's research on harmonic patterns in technical analysis focuses on precise price structures based on Fibonacci ratios to identify market reversals.
Key patterns include the Gartley, Bat, Butterfly, and Crab, each with specific alignment criteria. These patterns help traders anticipate potential market turning points and make informed trading decisions, enhancing the predictability of technical analysis.
🟣 Understanding 5-Point Harmonic Patterns
In the current library version, you can easily draw and customize most XABCD patterns. These patterns often form M or W shapes, or a combination of both. By calculating the Fibonacci ratios between key points, you can estimate potential price movements.
All five-point patterns share a similar structure, differing only in line lengths and Fibonacci ratios. Learning one pattern simplifies understanding others.
🟣 Exploring the Gartley Pattern
The Gartley pattern appears in both bullish (M shape) and bearish (W shape) forms. In the bullish Gartley, point X is below point D, and point A surpasses point C. Point D marks the start of a strong upward trend, making it an optimal point to place a buy order.
The bearish Gartley mirrors the bullish pattern with inverted Fibonacci ratios. In this scenario, point D indicates the start of a significant price drop. Traders can place sell orders at this point and buy at lower prices for profit in two-way markets.
🟣 Analyzing the Butterfly Pattern
The Butterfly pattern also manifests in bullish (M shape) and bearish (W shape) forms. It resembles the Gartley pattern but with point D lower than point X in the bullish version.
The Butterfly pattern involves deeper price corrections than the Gartley, leading to more significant price fluctuations. Point D in the bullish Butterfly indicates the beginning of a sharp price rise, making it an entry point for buy orders.
The bearish Butterfly has inverted Fibonacci ratios, with point D marking the start of a sharp price decline, ideal for sell orders followed by buying at lower prices in two-way markets.
🟣 Insights into the Bat Pattern
The Bat pattern, appearing in bullish (M shape) and bearish (W shape) forms, is one of the most precise harmonic patterns. It closely resembles the Butterfly and Gartley patterns, differing mainly in Fibonacci levels.
The bearish Bat pattern shares the Fibonacci ratios with the bullish Bat, with an inverted structure. Point D in the bearish Bat marks the start of a significant price drop, suitable for sell orders followed by buying at lower prices for profit.
🟣 The Crab Pattern Explained
The Crab pattern, found in both bullish (M shape) and bearish (W shape) forms, is highly favored by analysts. Discovered in 2000, the Crab pattern features a larger final wave correction compared to other harmonic patterns.
The bearish Crab shares Fibonacci ratios with the bullish version but in an inverted form. Point D in the bearish Crab signifies the start of a sharp price decline, making it an ideal point for sell orders followed by buying at lower prices for profitable trades.
🟣 Understanding the Shark Pattern
The Shark pattern appears in bullish (M shape) and bearish (W shape) forms. It differs from previous patterns as point C in the bullish Shark surpasses point A, with unique level measurements.
The bearish Shark pattern mirrors the Fibonacci ratios of the bullish Shark but is inverted. Point D in the bearish Shark indicates the start of a sharp price drop, ideal for placing sell orders and buying at lower prices to capitalize on the pattern.
🟣 The Cypher Pattern Overview
The Cypher pattern is another that appears in both bullish (M shape) and bearish (W shape) forms. It resembles the Shark pattern, with point C in the bullish Cypher extending beyond point A, and point D forming within the XA line.
The bearish Cypher shares the Fibonacci ratios with the bullish Cypher but in an inverted structure. Point D in the bearish Cypher marks the start of a significant price drop, perfect for sell orders followed by buying at lower prices.
🟣 Introducing the Nen-Star Pattern
The Nen-Star pattern appears in both bullish (M shape) and bearish (W shape) forms. In the bullish Nen-Star, point C extends beyond point A, and point D, the final point, forms outside the XA line, making CD the longest wave.
The bearish Nen-Star has inverted Fibonacci ratios, with point D indicating the start of a significant price drop. Traders can place sell orders at point D and buy at lower prices to profit from this pattern in two-way markets.
The 5-point harmonic patterns, commonly referred to as XABCD patterns, are specific geometric price structures identified in financial markets. These patterns are used by traders to predict potential price movements based on historical price data and Fibonacci retracement levels.
Here are the main 5-point harmonic patterns :
Gartley Pattern
Anti-Gartley Pattern
Bat Pattern
Anti-Bat Pattern
Alternate Bat Pattern
Butterfly Pattern
Anti-Butterfly Pattern
Crab Pattern
Anti-Crab Pattern
Deep Crab Pattern
Shark Pattern
Anti- Shark Pattern
Anti Alternate Shark Pattern
Cypher Pattern
Anti-Cypher Pattern
🔵 How to Use
To add "Order Block Refiner Library", you must first add the following code to your script.
import TFlab/Harmonic_Chart_Pattern_Library_TradingFinder/1 as HP
🟣 Parameters
XABCD(Name, Type, Show, Color, LineWidth, LabelSize, ShVF, FLPC, FLPCPeriod, Pivot, ABXAmin, ABXAmax, BCABmin, BCABmax, CDBCmin, CDBCmax, CDXAmin, CDXAmax) =>
Parameters:
Name (string)
Type (string)
Show (bool)
Color (color)
LineWidth (int)
LabelSize (string)
ShVF (bool)
FLPC (bool)
FLPCPeriod (int)
Pivot (int)
ABXAmin (float)
ABXAmax (float)
BCABmin (float)
BCABmax (float)
CDBCmin (float)
CDBCmax (float)
CDXAmin (float)
CDXAmax (float)
🟣 Genaral Parameters
Name : The name of the pattern.
Type: Enter "Bullish" to draw a Bullish pattern and "Bearish" to draw an Bearish pattern.
Show : Enter "true" to display the template and "false" to not display the template.
Color : Enter the desired color to draw the pattern in this parameter.
LineWidth : You can enter the number 1 or numbers higher than one to adjust the thickness of the drawing lines. This number must be an integer and increases with increasing thickness.
LabelSize : You can adjust the size of the labels by using the "size.auto", "size.tiny", "size.smal", "size.normal", "size.large" or "size.huge" entries.
🟣 Logical Parameters
ShVF : If this parameter is on "true" mode, only patterns will be displayed that they have exact format and no noise can be seen in them. If "false" is, the patterns displayed that maybe are noisy and do not exactly correspond to the original pattern.
FLPC : if Turned on, you can see this ability of patterns when their last pivot is formed. If this feature is off, it will see the patterns as soon as they are formed. The advantage of this option being clear is less formation of fielded patterns, and it is accompanied by the lateest pattern seeing and a sharp reduction in reward to risk.
FLPCPeriod : Using this parameter you can determine that the last pivot is based on Pivot period.
Pivot : You need to determine the period of the zigzag indicator. This factor is the most important parameter in pattern recognition.
ABXAmin : Minimum retracement of "AB" line compared to "XA" line.
ABXAmax : Maximum retracement of "AB" line compared to "XA" line.
BCABmin : Minimum retracement of "BC" line compared to "AB" line.
BCABmax : Maximum retracement of "BC" line compared to "AB" line.
CDBCmin : Minimum retracement of "CD" line compared to "BC" line.
CDBCmax : Maximum retracement of "CD" line compared to "BC" line.
CDXAmin : Minimum retracement of "CD" line compared to "XA" line.
CDXAmax : Maximum retracement of "CD" line compared to "XA" line.
🟣 Function Outputs
This library has two outputs. The first output is related to the alert of the formation of a new pattern. And the second output is related to the formation of the candlestick pattern and you can draw it using the "plotshape" tool.
Candle Confirmation Logic :
Example :
import TFlab/Harmonic_Chart_Pattern_Library_TradingFinder/1 as HP
PP = input.int(3, 'ZigZag Pivot Period')
ShowBull = input.bool(true, 'Show Bullish Pattern')
ShowBear = input.bool(true, 'Show Bearish Pattern')
ColorBull = input.color(#0609bb, 'Color Bullish Pattern')
ColorBear = input.color(#0609bb, 'Color Bearish Pattern')
LineWidth = input.int(1 , 'Width Line')
LabelSize = input.string(size.small , 'Label size' , options = )
ShVF = input.bool(false , 'Show Valid Format')
FLPC = input.bool(false , 'Show Formation Last Pivot Confirm')
FLPCPeriod =input.int(2, 'Period of Formation Last Pivot')
//Call function
= HP.XABCD('Bullish Bat', 'Bullish', ShowBull, ColorBull , LineWidth, LabelSize ,ShVF, FLPC, FLPCPeriod, PP, 0.382, 0.50, 0.382, 0.886, 1.618, 2.618, 0.85, 0.9)
= HP.XABCD('Bearish Bat', 'Bearish', ShowBear, ColorBear , LineWidth, LabelSize ,ShVF, FLPC, FLPCPeriod, PP, 0.382, 0.50, 0.382, 0.886, 1.618, 2.618, 0.85, 0.9)
//Alert
if BearAlert
alert('Bearish Harmonic')
if BullAlert
alert('Bulish Harmonic')
//CandleStick Confirm
plotshape(BearCandleConfirm, style = shape.arrowdown, color = color.red)
plotshape(BullCandleConfirm, style = shape.arrowup, color = color.green, location = location.belowbar )

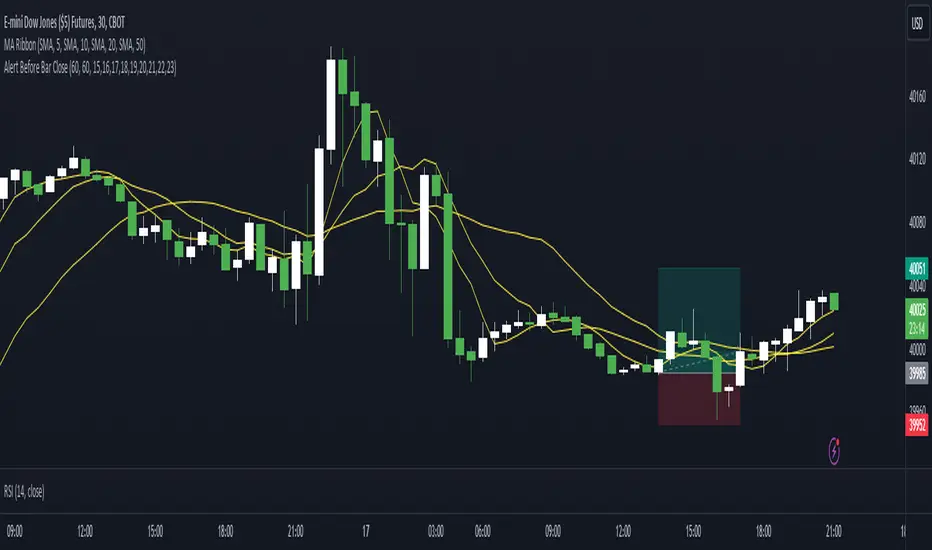
Alert Before Bar Closei.imgur.com
Alert Before Bar Close
==========================
Example Figure
Originality and usefulness
This indicator/alert mechanism is unique in two ways. First, it provides alerts before the close of a candlestick, allowing time-based traders to prepare early to determine if the market is about to form a setup. Second, it introduces an observation time mechanism, enabling time-based traders to observe when the market is active, thereby avoiding too many false signals during electronic trading or when trading is light.
Detail
Regarding the settings (Arrow 1). The first input is to select the candlestick period you want to observe. The second is to notify a few seconds in advance. The third input sets the observation time. For example, if you set "1,2,3,4,5," the alert mechanism will only be activated during the period from 01:00:00 to 05:59:59, consistent with the time zone you set in TradingView. Additionally, I have set it so that the alert will only trigger once per candlestick, so don't worry about repeated alerts.
The alert setup is very simple, too. Follow the steps (Arrow 2, 3) to complete the setup. I have tested several periods and successfully received alerts on both mobile and computer. If anyone encounters any issues, feel free to let me know.
Normalised T3 Oscillator [BackQuant]Normalised T3 Oscillator
The Normalised T3 Oscillator is an technical indicator designed to provide traders with a refined measure of market momentum by normalizing the T3 Moving Average. This tool was developed to enhance trading decisions by smoothing price data and reducing market noise, allowing for clearer trend recognition and potential signal generation. Below is a detailed breakdown of the Normalised T3 Oscillator, its methodology, and its application in trading scenarios.
1. Conceptual Foundation and Definition of T3
The T3 Moving Average, originally proposed by Tim Tillson, is renowned for its smoothness and responsiveness, achieved through a combination of multiple Exponential Moving Averages and a volume factor. The Normalised T3 Oscillator extends this concept by normalizing these values to oscillate around a central zero line, which aids in highlighting overbought and oversold conditions.
2. Normalization Process
Normalization in this context refers to the adjustment of the T3 values to ensure that the oscillator provides a standard range of output. This is accomplished by calculating the lowest and highest values of the T3 over a user-defined period and scaling the output between -0.5 to +0.5. This process not only aids in standardizing the indicator across different securities and time frames but also enhances comparative analysis.
3. Integration of the Oscillator and Moving Average
A unique feature of the Normalised T3 Oscillator is the inclusion of a secondary smoothing mechanism via a moving average of the oscillator itself, selectable from various types such as SMA, EMA, and more. This moving average acts as a signal line, providing potential buy or sell triggers when the oscillator crosses this line, thus offering dual layers of analysis—momentum and trend confirmation.
4. Visualization and User Interaction
The indicator is designed with user interaction in mind, featuring customizable parameters such as the length of the T3, normalization period, and type of moving average used for signals. Additionally, the oscillator is plotted with a color-coded scheme that visually represents different strength levels of the market conditions, enhancing readability and quick decision-making.
5. Practical Applications and Strategy Integration
Traders can leverage the Normalised T3 Oscillator in various trading strategies, including trend following, counter-trend plays, and as a component of a broader trading system. It is particularly useful in identifying turning points in the market or confirming ongoing trends. The clear visualization and customizable nature of the oscillator facilitate its adaptation to different trading styles and market environments.
6. Advanced Features and Customization
Further enhancing its utility, the indicator includes options such as painting candles according to the trend, showing static levels for quick reference, and alerts for crossover and crossunder events, which can be integrated into automated trading systems. These features allow for a high degree of personalization, enabling traders to mold the tool according to their specific trading preferences and risk management requirements.
7. Theoretical Justification and Empirical Usage
The use of the T3 smoothing mechanism combined with normalization is theoretically sound, aiming to reduce lag and false signals often associated with traditional moving averages. The practical effectiveness of the Normalised T3 Oscillator should be validated through rigorous backtesting and adjustment of parameters to match historical market conditions and volatility.
8. Conclusion and Utility in Market Analysis
Overall, the Normalised T3 Oscillator by BackQuant stands as a sophisticated tool for market analysis, providing traders with a dynamic and adaptable approach to gauging market momentum. Its development is rooted in the understanding of technical nuances and the demand for a more stable, responsive, and customizable trading indicator.
Thus following all of the key points here are some sample backtests on the 1D Chart
Disclaimer: Backtests are based off past results, and are not indicative of the future.
INDEX:BTCUSD
INDEX:ETHUSD
BINANCE:SOLUSD

Price alert multi symbols (Miu)This indicator won't plot anything to the chart.
Please follow steps below to set your alarms based on multiple symbols' prices:
1) Add indicator to the chart
2) Go to settings
3) Check symbols you want to receive alerts (choose up to 8 different symbols)
4) Set price for each symbol
5) Once all is set go back to the chart and click on 3 dots to set alert in this indicator, rename your alert and confirm
6) You can remove indicator after alert is set and it'll keep working as expected
What does this indicator do?
This indicator will generate alerts based on following conditions:
- If price set is met for any symbol
Once condition is met it will send an alert with the following information:
- Symbol name (e.g: BTC, ETH, LTC)
- Price reached
This script requests current price for each symbol through request.security() built-in function. It also requests amount of digits (mintick) for each symbol to send alerts with correct value.
This script was developed to attend a demand from a comment in other published script.
Feel free to give feedbacks on comments section below.
Enjoy!
FOMO Alert (Miu)This indicator won't plot anything to the chart.
Please follow steps below to set your alarms based on price range variation:
1) Add indicator to the chart
2) Go to settings
3) Choose timeframe which will be used to calculate bars
4) Choose how many bars which will be used to calculate max and min range
5) Choose max and min range variation (%) to trigger alerts
5) Choose up to 6 different symbols to get alert notification
6) Once all is set go back to the chart and click on 3 dots to set alert in this indicator, rename your alert and confirm
7) You can remove indicator after alert is set and it'll keep working as expected
What does this indicator do?
This indicator will generate alerts based on following conditions:
- If min and max prices reach the range (%) from amount of bars on timeframe set for any symbol checked it will trigger an alert.
- If next set of bars reaches higher range than before it will trigger an alert with new data
- If next set of bars doesn't reach higher range than before it will not trigger alerts, even if they are above the range set (this is to prevent the alert to keep triggering with high frequency)
Once condition is met it will send an alert with the following information:
- Symbol name (e.g: BTC, ETH, LTC)
- Range achieved (e.g: 3,03%)
- Current symbol price and current bar direction (e.g: 63,477.1 ▲)
This script will request lowest and highest prices through request.security() built-in function from all different symbols within the range set. It also requests symbols' price (close) and amount of digits (mintick) for each symbol to send alerts with correct value.
This script was developed with main purpose to send alerts when there are strong price movements and I decided to share with community so anyone can set different parameters for different purposes.
Feel free to give feedbacks on comments section below.
Enjoy!

Alert Sender Library [TradingFinder]Library "AlertSenderLibrary_TradingFinder"
🔵 Introduction
The "Alert Sender Library" is a management and production program for "Alert Messages" that enables the creation of unique messages for any type of signal generated by indicators or strategies.
These messages include the direction of the signal, symbol, time frame, the date and time the condition was triggered, prices related to the signal, and a personal message from you. To make better and more optimal use of this "library", you should carefully study " Key Features" and "How to Use".
🔵 Key Features
Automatic Detection of Appropriate Type :
Using two parameters, "AlertType" and "DetectionType", which you must enter at the beginning into the "AlertSender" function, the type of the alert message is determined.
For example, if you select one of the "DetectionType"s such as "Order Block Signal", "Signal", and "Setup", your alert type will be chosen based on "Long" and "Short". Whether it's "Long" or "Short" depends on the "AlertType" you have set to either "Bullish" or "Bearish".
Automatic Symbol Detection :
Whenever you add an alert for a specific symbol, if you want the name of that symbol to be in your message text, you must manually write the name of the symbol in your message. One of the capabilities of the "Alert Sender" is the automatic detection of the symbol and adding it to the message text.
Automatic Time Frame Detection :
When adding your alert, the "Alert Sender" detects the time frame of the symbol you intend to add the alert for and adds it to the text. This feature is very practical and can prevent traders from making mistakes.
For example, a trader might add alerts for a specific symbol using a specific indicator in different time frames, taking the main signal in the 1-hour time frame and only a confirmation signal in the 15-minute time frame. This feature helps to identify in which time frame the signal is set.
Detection of Date and Time When the Signal is Triggered :
You can have the date and time at the moment the message is sent. This feature has various uses. For example, if you use the Webhook URL feature to send messages to a Telegram channel, there might be issues with alert delivery on your server, causing delays, and you might receive the message when it has lost its validity.
With this feature, you can match the sending time of the message from TradingView with the receipt time in your messenger and detect if there is a delay in message delivery.
Important :
You can also set the Time Zone you wish to receive the date and time based on.
Display of "Key Prices" :
Key prices can vary based on the type of signals. For example, when the "DetectionType" is in "Order Block Signal" mode, the key prices are the "Distal" and "Proximal" prices. Or if the "DetectionType" is in "Setup" mode, the key prices are "Entry", "Stop Loss", and "Take Profit".
Receipt of Personal "Messages" :
You can enter your personal message using "input.string" or "input.text_area" in addition to the messages that are automatically created.
Beautiful and Functional Display of Messages :
The titles of messages sent by "AlertSender" are displayed using related emojis to prevent mistakes due to visual errors, enhancing beauty.
🔵 How to Use
🟣 Familiarity with Function and Parameters
AlertSender(Condition, Alert, AlertName, AlertType, DetectionType, SetupData, Frequency, UTC, MoreInfo, Message, o, h, l, c, Entry, TP, SL, Distal, Proximal)
Parameters:
- Condition (bool)
- Alert (string)
- AlertName (string)
- AlertType (string)
- DetectionType (string)
- SetupData (string)
- Frequency (string)
- UTC (string)
- MoreInfo (string)
- Message (string)
- o (float)
- h (float)
- l (float)
- c (float)
- Entry (float)
- TP (float)
- SL (float)
- Distal (float)
- Proximal (float)
To add "Alert Sender Library", you must first add the following code to your script.
import TFlab/AlertSenderLibrary_TradingFinder/1
🟣 Parameters
"Condition" : This parameter is a Boolean. You need to set it based on the condition that, when met (or fired), you want to receive an alert. The output should be either "true" or "false".
"Alert" : This parameter accepts one of two inputs, "On" or "Off". If set to "On", the alarm is active; if "Off", the alarm is deactivated. This input is useful when you have numerous alerts in an indicator or strategy and need to activate only a few of them. "Alert" is a string parameter.
Alert = input.string('On', 'Alert', , 'If you turn on the Alert, you can receive alerts and notifications after setting the "Alert".', group = 'Alert')
"AlertName" : This is a string parameter where you can enter the name you choose for your alert.
AlertName = input.string('Order Blocks Finder ', 'Alert Name', group = 'Alert')
"AlertType" : The inputs for this parameter are "Bullish" or "Bearish". If the condition selected in the "Condition" parameter is of a bullish bias, you should set this parameter to "Bullish", and if the condition is of a bearish bias, it should be set to "Bearish". "AlertType" is a string parameter.
"DetectionType" : This parameter's predefined inputs include "Order Block Signal", "Signal", "Setup", and "Analysis". You may provide other inputs, but some functionalities, like "Key Price", might be lost. "DetectionType" is a string parameter.
"SetupData" :
If "DetectionType" is set to "Setup", you must specify "SetupData" as either "Basic" or "Full". In "Basic" mode, only the "Entry" price needs to be defined in the function, and "TP" (Take Profit) and "SL" (Stop Loss) can be any number or NA. In "Full" mode, you need to define "Entry", "SL", and "TP". "Setup" is a string parameter.
"Frequency" : This string parameter defines the announcement frequency. Choices include: "All" (activates the alert every time the function is called), "Once Per Bar" (activates the alert only on the first call within the bar), and "Once Per Bar Close" (the alert is activated only by a call at the last script execution of the real-time bar upon closing). The default setting is "Once per Bar".
Frequency = input.string('Once Per Bar', 'Message Frequency', , 'The triggering frequency. Possible values are: All (all function calls trigger the alert), Once Per Bar (the first function call during the bar triggers the alert), Per Bar Close (the function call triggers the alert only when it occurs during the last script iteration of the real-time bar, when it closes). The default is alert.freq_once_per_bar.', group = 'Alert')
"UTC" : With this parameter, you can set the Time Zone for the date and time of the alert's dispatch. "UTC" is a string parameter and can be set as "UTC-4", "UTC+1", "UTC+9", or any other Time Zone.
UTC = input.string('UTC', 'Show Alert time by Time Zone', group = 'Alert')
"MoreInfo" : This parameter can take one of two inputs, "On" or "Off", which are strings. Additional information, including "Time" and "Key Price", is included. If set to "On", this information is received; if "Off", it is not displayed in the sent message.
MoreInfo = input.string('On', 'Display More Info', , group = 'Alert')
"Message" : This parameter captures the user's personal message through an input and displays it at the end of the sent message. It is a string input.
MessageBull = input.text_area('Long Position', 'Long Signal Message', group = 'Alert') MessageBear = input.text_area('Short Position', 'Short Signal Message', group = 'Alert')
"o" (Open Price): A floating-point number representing the opening price of the candle. This input is necessary when the "DetectionType" is set to "Signal". Otherwise, it can be any number or "na".
"h" (High Price): A float variable for the highest price of the candle. Required when "DetectionType" is "Signal"; in other cases, any number or "na" is acceptable.
"l" (Low Price): A float representing the lowest price of the candle. This field must be filled if "DetectionType" is "Signal". If not, it can be any number or "na".
"c" (Close Price): A floating-point variable indicating the closing price of the candle. Needed for "Signal" type detections; otherwise, it can take any value or "na".
"Entry" : A float variable indicating the entry price into a trading setup. This is relevant when "DetectionType" is in "Setup" mode. In other scenarios, it can be any number or "na". It denotes the price at which the trade setup is entered.
"TP" (Take Profit): A float that is necessary when "DetectionType" is "Setup" and "SetupData" is "Full". Otherwise, it can be any number or "na". It signifies the price target for taking profits in a trading setup.
"SL" (Stop Loss): A float required when "DetectionType" is "Setup" and "SetupData" is "Full". It can be any number or "na" in other cases. This value represents the price at which a stop loss is set to limit losses.
"Distal" : A float important for "Order Block Signal" detection. It can be any number or "na" if not in use. This variable indicates the price reaching the distal line of an order block.
"Proximal" : A float needed for "Order Block Signal" detection mode. It can take any value or "na" otherwise. It marks the price reaching the proximal line of an order block.

High Volume AlertThe High Volume Alert Script is developed for all traders focusing on volume analysis in their trading strategies, providing alerts for unusually high trading volumes during specified trading sessions.
Functionality:
Volume Moving Average Calculation:
Average Volume = Moving Average(Volume) = Sum of last the x last candles Volume
Where n is the user-defined period for the moving average calculation (denoted as movingaverageinput in the script. This moving average serves as the baseline to compare current volume levels against historical averages.
High Volume Detection:
HighVolume = CurrentVolume >= (MA(Volume) x HighVolumeRatio)
Here, HighVolumeRatio is a user-defined multiplier that sets the threshold for what is considered high volume. If the current volume exceeds this threshold (the product of the moving average of volume and the HighVolumeRatio ), the script identifies this as a high-volume event.
Session Filtering:
The script further refines these alerts by ensuring they only trigger during the specified trading session, enhancing relevance for traders interested in specific market hours. This session is defined by the sess and timezone parameters.
Visualisation and Alerts:
If high volume is detected (HighVolume = True), the script colors the volume bar with the highVolumeColor . If the option is selected, it also changes the color of the candlestick to either highVolumeCandleColorUp (for bullish candles) or highVolumeCandleColorDown (for bearish candles), depending on the price movement within the high-volume period. An alert is generated through the alertcondition function when high volume is detected during the specified session, notifying the trader of potentially significant market activity.
Application in Trading:
This indicator serves traders who prioritize volume as a leading indicator of potential price movement. High trading volumes may indicate the presence of significant market activity, often associated with events like news releases, market openings, or large trades, which can precede price movements.
Originality and Practicality:
This script is self-developed, aiming to fill the gap in automatic ratio adjusted volume alerts within the TradingView environment.
Conclusion:
The High Volume Alert Script is an essential tool for traders who integrate volume analysis into their strategy, offering tailored alerts and visual cues for high volume periods.
Compliance and Limitations:
The script complies with TradingView scripting standards, ensuring no lookahead bias and maintaining real-time data integrity. However, its utility depends on the availability on volume data, and please be aware that forex pairs never offer real volume data, this tool is best used with a exchange traded symbol.
How to force strategies fire exit alerts not reversalsPineScript has gone a long way, from very simple and little-capable scripting language to a robust coding platform with reliable execution endpoints. However, this one small intuitivity glitch is still there and is likely to stay, because it is traditionally justified and quite intuitive for significant group of traders. I'm sharing this workaround in response to frequent inquiries about it.
What's the glitch? When setting alerts on strategies to be synchronized with TradingView's Strategy Tester events, using simple alert messages such as "buy" or "sell" based on entry direction seems straightforward by inserting {{strategy.order.action}} into the Create Alert's "Message" field. Because "buy" or "sell" are exactly the strings produced by {{strategy.order.action}} placeholder. However, complications arise when attempting to EXIT positions without reversing, whether triggered by price levels like Stop Loss or Take Profit, or logical conditions to close trades. Those bricks fall apart, because on such events {{strategy.order.action}} sends the same "sell" for exiting buy positions and "buy" for exiting sell positions, instead of something more differentiating like "closebuy" or "closesell". As a result reversal trades are opened, instead of simply closing the open ones.
This convention harkens back to traditional stock market practices, where traders either bought shares to enter positions or sold them to exit. However, modern trading encompasses diverse instruments like CFDs, indices, and Forex, alongside advanced features such as Stop Loss, reshaping the landscape. Despite these advancements, the traditional nomenclature persists.
And is poised to stay on TradingView as well, so we need a workaround to get a simple strategy going. Luckily it is here and is called alert_message . It is a parameter, which needs to be added into each strategy.entry() / strategy.exit() / strategy.close() function call - each call, which causes Strategy Tester to produce entry or exit orders. As in this example script:
line 12: strategy.entry(... alert_message ="buy")
line 14: strategy.entry(... alert_message ="sell")
line 19: strategy.exit(... alert_message ="closebuy")
line 20: strategy.exit(... alert_message ="closesell")
line 24: strategy.close(... alert_message ="closebuy")
line 26: strategy.close(... alert_message ="closesell")
These alert messages are compatible with the Alerts Syntax of TradingConnector - a tool facilitating auto-execution of TradingView alerts in MetaTrader 4 or 5. Yes, simple alert messages like "buy" / "sell" / "closebuy" / "closesell" suffice to carry the execution of simple strategy, without complex JSON files with multiple ids and such. Other parameters can be added (actually plenty), but they are only option and that's not a part of this story :)
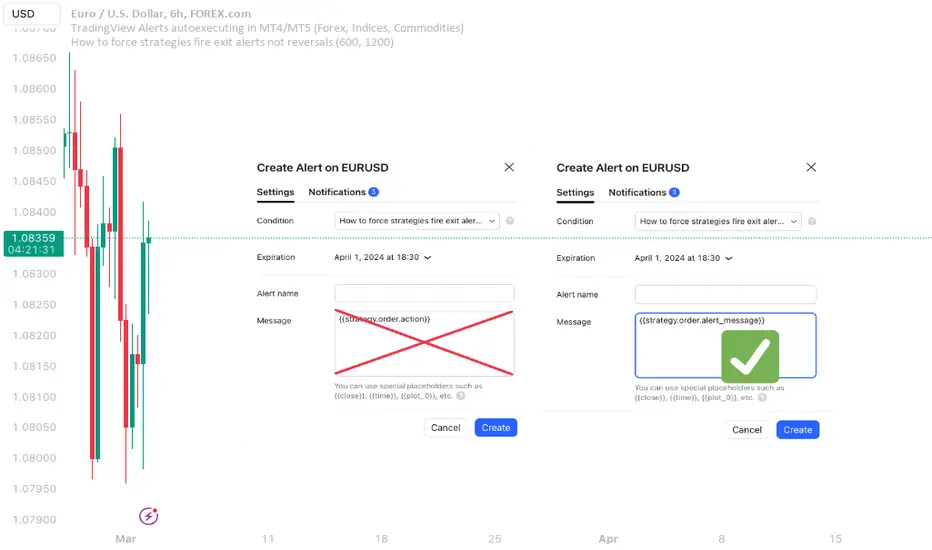
Last thing left to do is to replace "Message" in Create Alert popup with {{strategy.order.alert_message}} . This placeholder transmits the string defined in the PineScript alert_message= parameter, as outlined in this publication. With this workaround, executing closing alerts becomes seamless within PineScript strategies on TradingView.
Disclaimer: this content is purely educational, especially please don't pay attention to backtest results on any timeframe/ticker.
TrailingTakeProfit exampleQuite recently I came upon a concept of Trailing Take Profit and I couldn't find a PineScript which implements it for the fastest possible execution, so here it is :)
Everybody knows Trailing StopLoss - an invisible mechanism follows the price and exits the trade once the price retreats too much from its recent most extended favourable value. Trailing TakeProfit does the similar thing, but at the opposite end - the trade gets closed if a price moves too well, in too favourable extent.
Why close the trade if it is going so good? Well, whatever goes up, must go down and vice versa. It is expected, that after fast rally a market will soon fall and after a dump it will go up. So Trailing TakeProfit's role is to secure profits.
But how does Trailing TakeProfit differ from the standard one? "Trailing" means, the exit level is moving. Its role is to be executed only after a rapid favourable move within 1-2 candles, not more. We never know when a rapid move happens, but when it does, we wanna catch those pips and quickly exit without looking back.
Visually Trailing TakeProfit levels are... bands. In this script example these are ATR multiplied bands (aka Keltner Channel), but they could also be Bollinger Bands or something else.
The code is simple just to focus on this single functionality, so you can quickly copy-paste it into your script. Entries are triggered by default SMA crosses.
P.S. I wouldn't be myself, if I didn't add alert messages compatible with the syntax of recently revamped TradingConnector - both in the code already and in the table showing them.

Alert on Candle CloseAlert on Candle Close is a simple indicator allowing you to set alerts when a candlestick closes.
Instructions for use
From the chart window, click on "Indicators" and search for "Alert on Candle Close".
Click on "Alert on Candle Close" to add the indicator to your chart. Click on the star icon to add it to your favourites to easily access later.
Set your chart timeframe to the timeframe you wish to alert on. For example, to create an alert when a 4h candlestick closes, set your chart to the "4h" timeframe.
Hover over the "Alert on Candle Close" indicator which has been added to your chart and click the ellipsis "..." icon, then click "Add alert on Alert on Candle Close" or use the keyboard shortcut "Alt+A" from the chart.
In the alert pop-up window, make sure "Condition" is set to "Alert on Candle Close" and "Trigger" is set to "Once Per Bar".
Optionally, you can set a custom expiry for the alert, give the alert a name and customise the alert message. You can configure notification settings from the "Notifications" tab.
Click "Create" and your alert is set up!
Each alert is tied to the timeframe and chart it was created on, so you can change the timeframe or asset and create more alerts by repeating the above process.
Note : this indicator is only designed to work with time-based chart types, such as Bars, Candles or Heikin Ashi. It will not work for non-time charts such as Renko.
FAQs
Why do my alerts sometimes not fire as soon as the candle closes?
This is a limitation with Pine Script's execution model. Indicators are calculated whenever a price or volume change occurs i.e. when a new trade happens. For illiquid or slow moving markets, there may be some time between when a candle closes and the next trade, leading to a delay in the alert triggering. The alert will trigger on the next tick of data on the chart.
Why can't I create more alerts?
TradingView has a limit on the number of active technical alerts you can have based on your membership tier. To configure more alerts, consider upgrading your TradingView plan to a higher tier. See a comparison of TradingView plans at www.tradingview.com
My alert only fired once, how can I get it to keep working?
When configuring the alert in the alert pop-up window, make sure you set "Trigger" to "Once Per Bar" and "Expiration" to "Open-ended alert".

Scalp Pump-Dump Detector with AlertsThis script displays the percentage of movement of all candles on the chart, as well as identifying abnormal movements to which you can attach alerts. An abnormal movement is considered a rise or fall that exceeds the parameter set in the settings (by default, 1% per 1 bar).
Added a function to display the volume on abnormal candlesticks.
