OPEN-SOURCE SCRIPT
已更新 Daily Chart ATR & Movement %
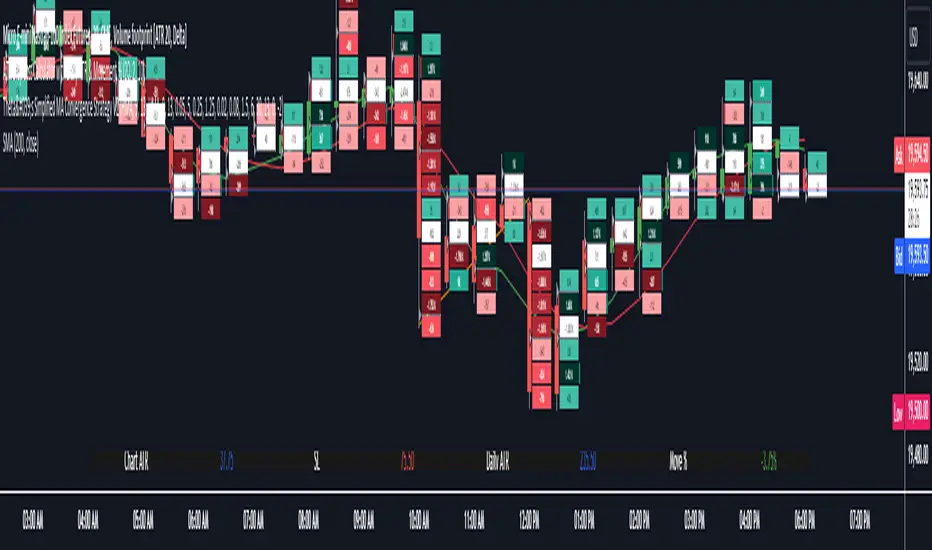
This Pine Script, titled "Daily ATR & Movement %," is designed for traders looking to gauge volatility and price movements relative to that volatility directly on their trading chart. The script calculates and displays the Average True Range (ATR) over a 14-day period using daily data, alongside the percentage movement of the current price from the previous day's close, scaled by the ATR. These metrics provide a snapshot of daily volatility and the magnitude of price movements within that context, which can be crucial for making informed trading decisions, especially in markets where volatility is a significant factor.
Key Features:
How to Use:
Setup: Apply the indicator to any chart.
Customization: Adjust the label size and vertical position to suit your viewing preference using the script’s input options.
Interpretation: Monitor the displayed ATR value and movement percentage to assess volatility and relative price movements. High percentages could indicate significant moves worth trading, while low percentages suggest minor changes.
This script is particularly useful for traders who rely on volatility-based trading strategies, such as breakout trading, where understanding the context of price movements relative to typical market fluctuations can provide a strategic edge.
Key Features:
- Daily ATR Calculation: Utilizes the ta.atr(14) function to compute the Average True Range on a daily basis, which measures market volatility by decomposing the entire range of asset prices for that day.
- Movement Percentage: The script calculates the movement from yesterday’s closing price to today’s current price as a percentage of the daily ATR. This shows how significant today's price change is relative to the typical daily volatility, which helps in understanding whether the price movement is substantial or trivial.
- Customizable Label Display: Traders can customize the display through a user input dropdown menu for label size ("small", "normal", "large", "huge") and a slider for vertical offset. This allows for better visibility and customization based on user preference and screen setup.
- Dynamic Label Updates: A label is dynamically updated each bar with the latest ATR value and movement percentage. This ongoing update keeps traders informed in real-time without manual recalculations.
How to Use:
Setup: Apply the indicator to any chart.
Customization: Adjust the label size and vertical position to suit your viewing preference using the script’s input options.
Interpretation: Monitor the displayed ATR value and movement percentage to assess volatility and relative price movements. High percentages could indicate significant moves worth trading, while low percentages suggest minor changes.
This script is particularly useful for traders who rely on volatility-based trading strategies, such as breakout trading, where understanding the context of price movements relative to typical market fluctuations can provide a strategic edge.
發行說明
Updates to width padding開源腳本
秉持TradingView一貫精神,這個腳本的創作者將其設為開源,以便交易者檢視並驗證其功能。向作者致敬!您可以免費使用此腳本,但請注意,重新發佈代碼需遵守我們的社群規範。
免責聲明
這些資訊和出版物並非旨在提供,也不構成TradingView提供或認可的任何形式的財務、投資、交易或其他類型的建議或推薦。請閱讀使用條款以了解更多資訊。
免責聲明
這些資訊和出版物並非旨在提供,也不構成TradingView提供或認可的任何形式的財務、投資、交易或其他類型的建議或推薦。請閱讀使用條款以了解更多資訊。