INVITE-ONLY SCRIPT
已更新 Bellcurves (Expo)
█ Overview
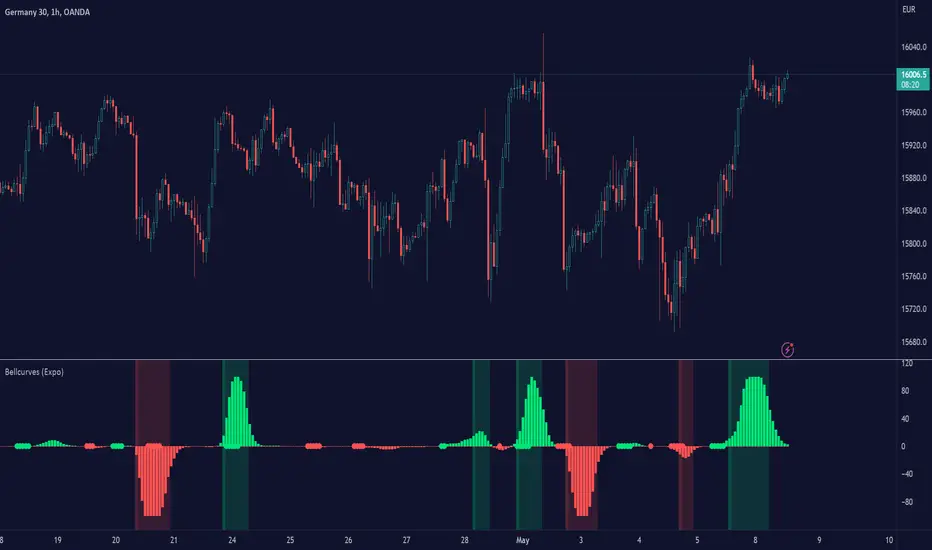
Bellcurves (Expo) indicator helps traders identify potential tops and bottoms, and gauge market impulses. It provides a clear view of the market by filtering out the noise and highlighting only the relevant information. This makes it easier for traders to identify potential market reversals and key support and resistance levels. With Bellcurves, traders can quickly and easily spot important market impulses.
█ How is Bellcurve calculated?
The Bellcurves indicator achieves this by focusing on the distribution of price data, rather than the individual price points themselves. This approach removes the noise from the data and allows traders to see the underlying price moves more clearly.
█ How to use
The unique perspective that Bellcurves offers can be especially useful in highly volatile markets. By providing a clearer view of the market impulses, Bellcurves can help traders stay ahead of market movements and take advantage of potential reversal setups.
Find Reversals
Take Profits
Impulses
█ Additional Indicator Features
-----------------
Disclaimer
The information contained in my Scripts/Indicators/Ideas/Algos/Systems does not constitute financial advice or a solicitation to buy or sell any securities of any type. I will not accept liability for any loss or damage, including without limitation any loss of profit, which may arise directly or indirectly from the use of or reliance on such information.
All investments involve risk, and the past performance of a security, industry, sector, market, financial product, trading strategy, backtest, or individual's trading does not guarantee future results or returns. Investors are fully responsible for any investment decisions they make. Such decisions should be based solely on an evaluation of their financial circumstances, investment objectives, risk tolerance, and liquidity needs.
My Scripts/Indicators/Ideas/Algos/Systems are only for educational purposes!
Bellcurves (Expo) indicator helps traders identify potential tops and bottoms, and gauge market impulses. It provides a clear view of the market by filtering out the noise and highlighting only the relevant information. This makes it easier for traders to identify potential market reversals and key support and resistance levels. With Bellcurves, traders can quickly and easily spot important market impulses.
█ How is Bellcurve calculated?
The Bellcurves indicator achieves this by focusing on the distribution of price data, rather than the individual price points themselves. This approach removes the noise from the data and allows traders to see the underlying price moves more clearly.
█ How to use
The unique perspective that Bellcurves offers can be especially useful in highly volatile markets. By providing a clearer view of the market impulses, Bellcurves can help traders stay ahead of market movements and take advantage of potential reversal setups.
Find Reversals
- The Bellcurves indicator shows price areas with a higher probability of a market reversal.
Take Profits
- The Bellcurves indicator can be used to identify potential exit points. For example, traders can exit their position when the Bellcurve starts to turn.
Impulses
- The height of the Bellcurve determines the strength of the price movement. The bigger the Bellcurve, the stronger the price move.
█ Additional Indicator Features
- Pre-Bellcurves: This feature highlights when a Bellcurve is about to plot.
- Oscillator mode: Traders can choose to display the Bellcurve as an oscillator.
- Momentum Impulse: Displays green and red dots when the momentum gets strong.
- Divergences: Highlights divergences between strong market impulses.
-----------------
Disclaimer
The information contained in my Scripts/Indicators/Ideas/Algos/Systems does not constitute financial advice or a solicitation to buy or sell any securities of any type. I will not accept liability for any loss or damage, including without limitation any loss of profit, which may arise directly or indirectly from the use of or reliance on such information.
All investments involve risk, and the past performance of a security, industry, sector, market, financial product, trading strategy, backtest, or individual's trading does not guarantee future results or returns. Investors are fully responsible for any investment decisions they make. Such decisions should be based solely on an evaluation of their financial circumstances, investment objectives, risk tolerance, and liquidity needs.
My Scripts/Indicators/Ideas/Algos/Systems are only for educational purposes!
發行說明
Performance Improvements! - Divergence is added
僅限邀請腳本
只有經作者授權的使用者才能訪問此腳本,且通常需付費。您可以將此腳本加入收藏,但需先向作者申請並獲得許可後才能使用 — 點擊此處了解更多。如需更多詳情,請依照作者說明或直接聯繫Zeiierman。
除非您完全信任其作者並了解腳本的工作原理,否則TradingView不建議您付費或使用腳本。您也可以在我們的社群腳本中找到免費的開源替代方案。
作者的說明
Get instant access here: https://zeiiermantrading.com
提醒:在請求訪問權限之前,請閱讀僅限邀請腳本指南。
Join Our Free Discord: discord.gg/zeiiermantrading
Access my indicators at: linktr.ee/zeiierman_trading
Earn $15
tradingview.com/gopro/?share_your_love=Zeiierman
SMC Trading
linktr.ee/zeiierman_trading
Access my indicators at: linktr.ee/zeiierman_trading
Earn $15
tradingview.com/gopro/?share_your_love=Zeiierman
SMC Trading
linktr.ee/zeiierman_trading
免責聲明
這些資訊和出版物並不意味著也不構成TradingView提供或認可的金融、投資、交易或其他類型的意見或建議。請在使用條款閱讀更多資訊。