INVITE-ONLY SCRIPT
TCT Candle Pro
TCT Candle Pro
Detail Explanation:
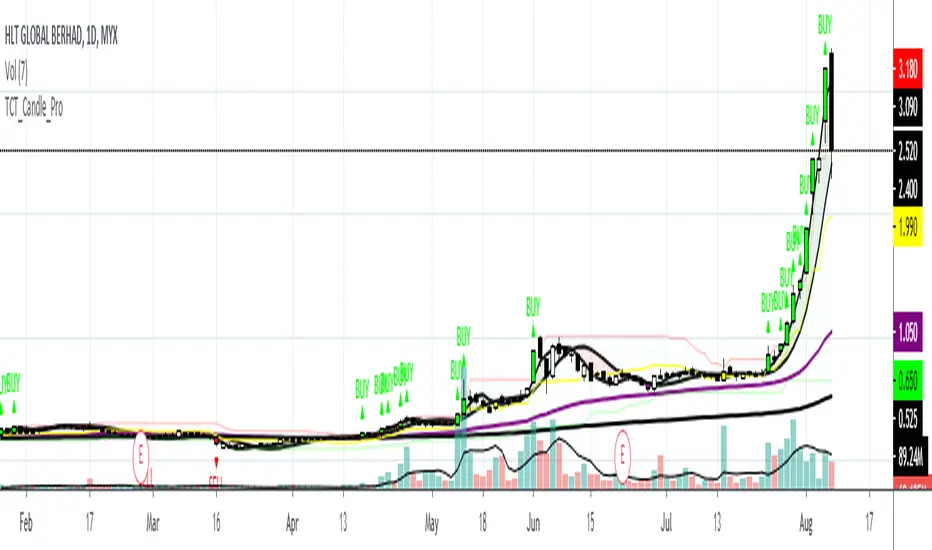
1. Red Candle
- Indicate that the market share is in a bearish trend and sell signal is triggered. It is when the price breaks certain support(referring to channel indicator) then the candle will turn to red.
2. Green Candle
- Indicate that the market share is in a bullish trend and buy signal is triggered but still needs another confirmation indicator. It is when the price breaks certain resistance(referring to the channel indicator) then the candle will turn to green.
3. Purple Line
- It is a moving average that indicates the lifeline of the market shares. Traders also can use the line as support.
4. Black Line
- It is a moving average that indicates the long term trend for the market shares.
5. Red Fill
- The fill will turn red when two moving average crossunder each other. It is customized to fill and the colors also can be changed to make the indicator more interesting to users.
6. Green Fill
- The fill will turn green when two moving average crossovers each other. It is customized to fill and the colors also can be changed to make the indicator more interesting to users.
How to use the indicators?
There are two lines that need to be focused on this indicator which is the Purple Line and Black Line.
When the Purple Line crossover Black Line, the momentum of the market share will start and usually the price will move upwards.
Users can try to use this indicator and wait for volume in when the Purple Line is nearing the Black Line or both lines crossover each other.
However, this indicator still needs other indicators for confirmation before clicking buy.
This indicators best to be used in timeframe 5minutes(tf5m), timeframe 30minutes(tf30m), and timeframe 1hour(tf60m).
Contact me if you want to try this indicator.
Detail Explanation:
1. Red Candle
- Indicate that the market share is in a bearish trend and sell signal is triggered. It is when the price breaks certain support(referring to channel indicator) then the candle will turn to red.
2. Green Candle
- Indicate that the market share is in a bullish trend and buy signal is triggered but still needs another confirmation indicator. It is when the price breaks certain resistance(referring to the channel indicator) then the candle will turn to green.
3. Purple Line
- It is a moving average that indicates the lifeline of the market shares. Traders also can use the line as support.
4. Black Line
- It is a moving average that indicates the long term trend for the market shares.
5. Red Fill
- The fill will turn red when two moving average crossunder each other. It is customized to fill and the colors also can be changed to make the indicator more interesting to users.
6. Green Fill
- The fill will turn green when two moving average crossovers each other. It is customized to fill and the colors also can be changed to make the indicator more interesting to users.
How to use the indicators?
There are two lines that need to be focused on this indicator which is the Purple Line and Black Line.
When the Purple Line crossover Black Line, the momentum of the market share will start and usually the price will move upwards.
Users can try to use this indicator and wait for volume in when the Purple Line is nearing the Black Line or both lines crossover each other.
However, this indicator still needs other indicators for confirmation before clicking buy.
This indicators best to be used in timeframe 5minutes(tf5m), timeframe 30minutes(tf30m), and timeframe 1hour(tf60m).
Contact me if you want to try this indicator.
僅限邀請腳本
只有經作者批准的使用者才能訪問此腳本。您需要申請並獲得使用權限。該權限通常在付款後授予。如欲了解更多詳情,請依照以下作者的說明操作,或直接聯絡Trader_Cenonet。
除非您完全信任其作者並了解腳本的工作原理,否則TradingView不建議您付費或使用腳本。您也可以在我們的社群腳本中找到免費的開源替代方案。
作者的說明
Contact me if you want to try other indicators like TAD Systems, MCDX, and many more. (t.me/afehakmal)
免責聲明
這些資訊和出版物並不意味著也不構成TradingView提供或認可的金融、投資、交易或其他類型的意見或建議。請在使用條款閱讀更多資訊。