OPEN-SOURCE SCRIPT
Price Relative / Relative Strength
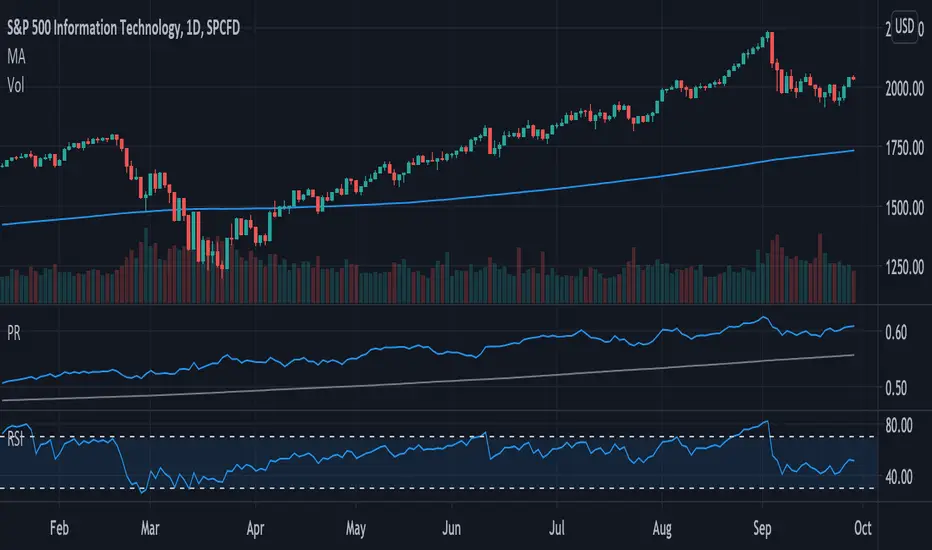
The Price Relative indicator compares the performance of one security to another. This indicator can be used to compare the performance of a stock against a benchmark index, such as the S&P 500, or its sector/industry group. This makes it possible to determine if a stock is leading or lagging its peers.
The Price Relative is used to gauge relative strength, which is important when it comes to stock selection. Many portfolio managers compare their performance to a benchmark, such as the S&P 500. Their goal is to outperform that benchmark. In order to achieve this goal, managers often look for stocks that are showing relative strength. Enter the Price Relative. The Price Relative rises when a stock shows relative strength and is outperforming its benchmark. Conversely, the Price Relative falls when a stock shows relative weakness and is underperforming its benchmark.
Source: https://school.stockcharts.com/doku.php?id=technical_indicators%3Aprice_relative
This script allows the user to
- Add a new indicator pane for Price Relative (PR)
- Edit the benchmark symbol (Comparative Symbol)
- Edit or hide the moving average
- Quickly determine if the symbol is outperforming or underperforming its benchmark
- Quickly determine if the symbols is trending higher or lower based on a simple moving average
開源腳本
秉持TradingView一貫精神,這個腳本的創作者將其設為開源,以便交易者檢視並驗證其功能。向作者致敬!您可以免費使用此腳本,但請注意,重新發佈代碼需遵守我們的社群規範。
免責聲明
這些資訊和出版物並非旨在提供,也不構成TradingView提供或認可的任何形式的財務、投資、交易或其他類型的建議或推薦。請閱讀使用條款以了解更多資訊。
免責聲明
這些資訊和出版物並非旨在提供,也不構成TradingView提供或認可的任何形式的財務、投資、交易或其他類型的建議或推薦。請閱讀使用條款以了解更多資訊。