OPEN-SOURCE SCRIPT
已更新 Cardwell RSI by TQ

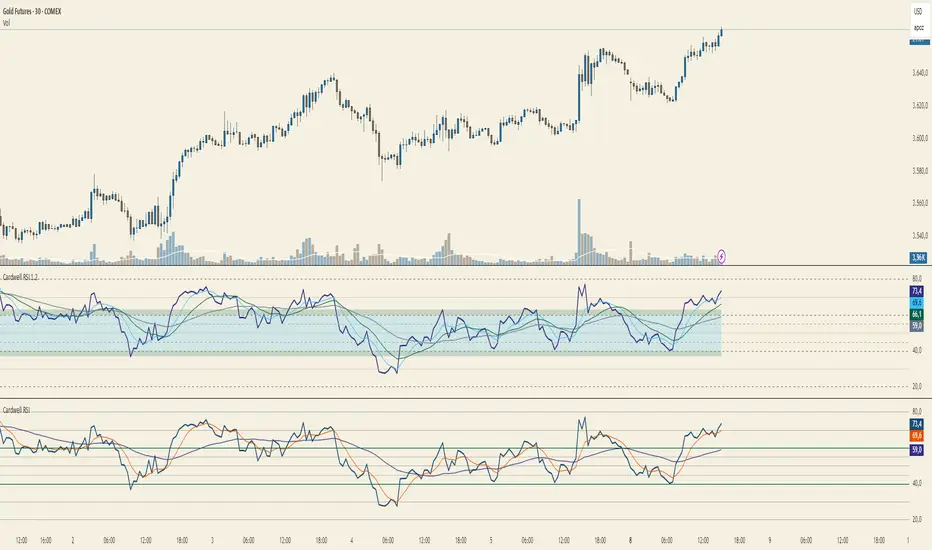
📌 Cardwell RSI – Enhanced Relative Strength Index
This indicator is based on Andrew Cardwell’s RSI methodology, extending the classic RSI with tools to better identify bullish/bearish ranges and trend dynamics.
Key Features:
How to Use:
Default Settings:
This indicator is based on Andrew Cardwell’s RSI methodology, extending the classic RSI with tools to better identify bullish/bearish ranges and trend dynamics.
In uptrends, RSI tends to hold between 40–80 (Cardwell bullish range).
In downtrends, RSI tends to stay between 20–60 (Cardwell bearish range).
Key Features:
- Standard RSI with configurable length & source
- Fast (9) & Slow (45) RSI Moving Averages (toggleable)
- Cardwell Core Levels (80 / 60 / 40 / 20) – enabled by default
- Base Bands (70 / 50 / 30) in dotted style
- Optional custom levels (up to 3)
- Alerts for MA crosses and level crosses
- Data Window metrics: RSI vs Fast/Slow MA differences
How to Use:
- Monitor RSI behavior inside Cardwell’s bullish (40–80) and bearish (20–60) ranges
- Watch RSI crossovers with Fast (9) and Slow (45) MAs to confirm momentum or trend shifts
[\*] Use levels and alerts as confluence with your trading strategy
Default Settings:
- RSI Length: 14
- MA Type: WMA
- Fast MA: 9 (hidden by default)
- Slow MA: 45 (hidden by default)
- Cardwell Levels (80/60/40/20): ON
- Base Bands (70/50/30): ON
發行說明
Changelog – Cardwell RSI → Cardwell RSI 1.2
1) Plot & Display
- RSI Line: remains, now in consistent color (#312e81), line width 2.
- Moving Averages: previously 2 (9/45); now 3 MAs:
– Fast (9), Custom (user-defined, default 20), Slow (45).
– All shown as lines (width 1).
– Default ON (showMAs = true instead of false). - Before: Fast MA was circles (style_circles).
Now: All MAs are uniform line style for clarity.
2) Levels & Bands
- Core Levels: 80 / 60 / 40 / 20 remain – colors adjusted for visibility on light backgrounds.
- New Mid Levels 55/45: highlight transition/confirmation zones.
- Legacy Bands 70/50/30: still optional (dotted), now darker for better contrast.
- Before: Up to 3 user-defined Custom Levels (C1/C2/C3).
Now: Removed → focus on Cardwell’s ranges & key mid-levels.
3) Regime Zones (new)
- Core Zone 60–40: highlighted with fill (light blue #38bdf8, ~20% visible).
- Throw Zones: above 60→63 and below 40→37 (dark green #065f46, ~20% visible).
- Purpose: Prevent misreading short spikes as regime shifts (Cardwell logic).
4) Colors & Readability
- Palette adapted for light background (#f5f0e1).
- Core levels = taupe shades, mid/legacy bands = darker taupe.
- MA colors unified: Fast = light blue, Custom = green, Slow = slate → quick visual separation.
5) Style Panel & Organization
- Cleaned-up titles: “Main RSI”, “MAs Fast/Custom/Slow”, “Level 80/60/…” etc.
- Helper plots for fills still technically required, but hidden (no titles) & placed at the bottom → less clutter in Style tab.
7) Data Window
- Deltas (RSI − Fast/Custom/Slow) still shown only in Data Window – not plotted.
Why these changes? (Purpose)
- Cardwell Logic made visible: 60/40 shown as zones instead of just lines; throw-bands filter false regime shifts.
- Better trend context: 55/45 mid-levels act as “rails” to assess transitions & confirmations.
- Three MAs = structure: Fast (timing), Custom (flexible filter), Slow (regime).
- MAs default ON: users immediately see rhythm/context.
- Clearer visuals: Lines instead of circles, subtle fills, readable colors → less visual noise, fewer false reads.
Migration – What changes for users?
- Custom levels C1/C2/C3: removed → replace with built-in 55/45 mid-levels if needed.
- Fast MA circles: gone; all MAs are line-style for clarity.
- MAs visible by default: those who prefer a “naked RSI” can toggle off.
- New fills: Core Zone + Throw Zones are ON by default. Can be turned off via showThrow or showBase.
開源腳本
秉持TradingView一貫精神,這個腳本的創作者將其設為開源,以便交易者檢視並驗證其功能。向作者致敬!您可以免費使用此腳本,但請注意,重新發佈代碼需遵守我們的社群規範。
免責聲明
這些資訊和出版物並非旨在提供,也不構成TradingView提供或認可的任何形式的財務、投資、交易或其他類型的建議或推薦。請閱讀使用條款以了解更多資訊。
開源腳本
秉持TradingView一貫精神,這個腳本的創作者將其設為開源,以便交易者檢視並驗證其功能。向作者致敬!您可以免費使用此腳本,但請注意,重新發佈代碼需遵守我們的社群規範。
免責聲明
這些資訊和出版物並非旨在提供,也不構成TradingView提供或認可的任何形式的財務、投資、交易或其他類型的建議或推薦。請閱讀使用條款以了解更多資訊。