OPEN-SOURCE SCRIPT
已更新 Multi-Timeframe Market Regime (Ehlers)
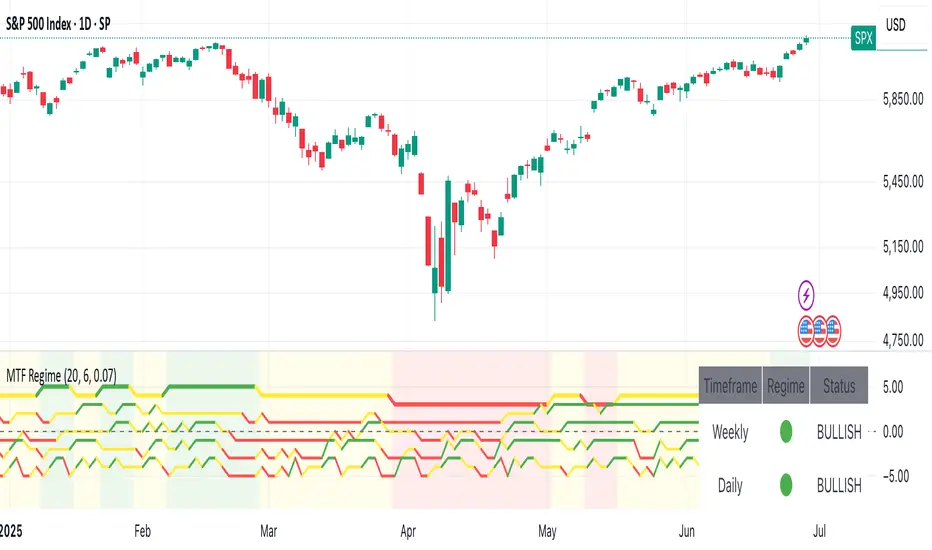
This Pine Script indicator provides an Ehlers-inspired multi-timeframe market regime analysis directly on your TradingView chart. It aims to identify whether the market is currently "Trending Up" (green), "Trending Down" (red), or "Ranging" (yellow) across Weekly, Daily, 4-Hour, and 1-Hour timeframes.
It uses custom implementations of:
Ehlers' Fisher Transform to highlight market extremes and potential turning points.
An Adaptive Moving Average (inspired by MAMA/FAMA) that adjusts its speed based on volatility to reduce lag in trends and provide stability in ranges.
The indicator displays a dashboard as a label on your chart, showing the detected regime for each of these timeframes, and optionally colors the background of your current chart timeframe to reflect its dominant regime.
發行說明
Multi time frame market regime indicators based on John Ehlers work. It shows the directional bias across multiple time frames.開源腳本
秉持TradingView一貫精神,這個腳本的創作者將其設為開源,以便交易者檢視並驗證其功能。向作者致敬!您可以免費使用此腳本,但請注意,重新發佈代碼需遵守我們的社群規範。
免責聲明
這些資訊和出版物並非旨在提供,也不構成TradingView提供或認可的任何形式的財務、投資、交易或其他類型的建議或推薦。請閱讀使用條款以了解更多資訊。
免責聲明
這些資訊和出版物並非旨在提供,也不構成TradingView提供或認可的任何形式的財務、投資、交易或其他類型的建議或推薦。請閱讀使用條款以了解更多資訊。