PROTECTED SOURCE SCRIPT
已更新 B4100 - NW Trend
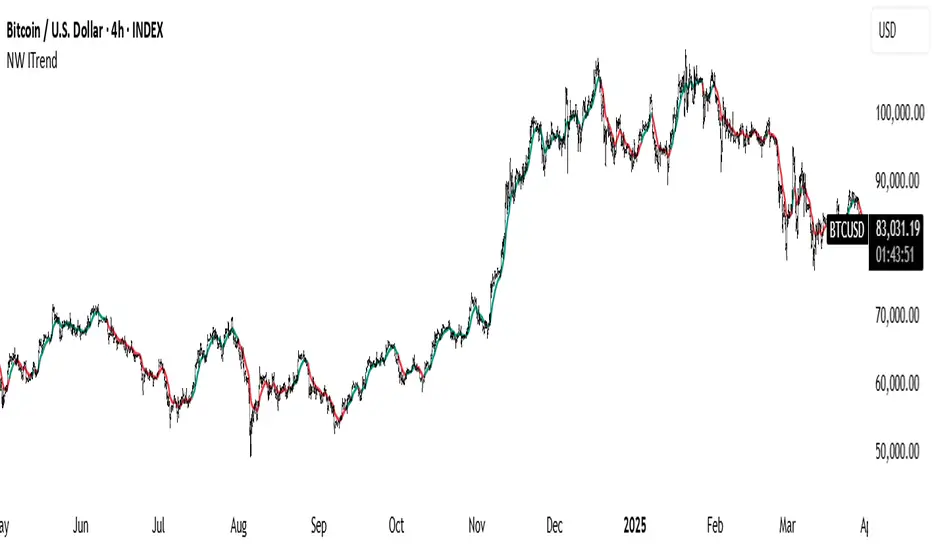
This is a trend-following tool based on the Nadaraya-Watson (NW) kernel regression estimator.
Nadaraya-Watson Estimator:
This indicator employs a weighted average of historical prices where the weights are determined by a kernel function. This kernel function gives more weight to recent prices and less weight to older ones. The kernel function's shape (Gaussian, Epanechnikov, or a combination) can be chosen by the user, and its bandwidth controls the sensitivity of the estimator. A smaller value means more sensitivity to short-term changes; a larger value means smoother curves and less sensitivity.
Trend Confirmation:
The indicator also uses a confirmation period (confirm_period) to minimize whipsaws. The trend only changes once the estimator has moved in a particular direction for a configurable number of consecutive bars.
Bandwidth (h):
This is the key parameter controlling the estimator's sensitivity to price changes.
Smaller values (e.g., 10-40) result in a more reactive and wiggly line. This will be more sensitive to short-term price changes.
Larger values (e.g., 100-200) result in a smoother line, focusing on longer-term trends.
Source:
The price data used in the calculations. The default is close but can be changed to other price values such as high, low, or a mathematical combination.
Kernel Type:
Select the type of kernel function to use.
Confirmation Period:
Adjust this setting to specify how many consecutive bars the estimator must be moving in the same direction before the trend is confirmed.
Lower values result in more trend changes.
Higher values result in fewer trend changes and can filter out some noise.
Enjoy, and good luck.
發行說明
Add Ehlers ITrend受保護腳本
此腳本以閉源形式發佈。 不過,您可以自由使用,沒有任何限制 — 點擊此處了解更多。
免責聲明
這些資訊和出版物並非旨在提供,也不構成TradingView提供或認可的任何形式的財務、投資、交易或其他類型的建議或推薦。請閱讀使用條款以了解更多資訊。
免責聲明
這些資訊和出版物並非旨在提供,也不構成TradingView提供或認可的任何形式的財務、投資、交易或其他類型的建議或推薦。請閱讀使用條款以了解更多資訊。