INVITE-ONLY SCRIPT
DEMA RSI For Loop | Rocheur
已更新

Introducing Rocheur's DEMA RSI For Loop Indicator
The DEMA RSI For Loop is an advanced trading indicator that combines the precision of the Double Exponential Moving Average (DEMA) with the analytical power of the Relative Strength Index (RSI) and a for-loop scoring mechanism. This unique integration enables traders to detect bullish and bearish market conditions with greater accuracy, providing a dynamic approach to trend analysis and decision-making.
At its core, the indicator applies DEMA to a smoothed RSI, enhancing responsiveness while minimizing lag. The scoring mechanism iterates over a range of RSI thresholds, assessing whether the smoothed RSI crosses these values. The result is a cumulative score that determines the current market condition: bullish, bearish, or neutral. This structure is particularly effective for filtering out market noise and identifying clear signals.
- How It Works
RSI Calculation: The indicator calculates the RSI over a user-defined length, which provides a momentum-based view of price movements.
DEMA Smoothing: The RSI values are smoothed using the DEMA, which reduces lag and sharpens trend detection.
For-Loop Scoring: The smoothed RSI is evaluated against a range of thresholds. For each step, the score increases if the smoothed RSI exceeds the threshold or decreases if it falls below. - Signal Generation:
Long Signals: When the score exceeds the positive threshold, a bullish trend is detected.
Short Signals: When the score drops below the negative threshold, a bearish trend is signaled. - Visual Representation
The DEMA RSI For Loop indicator is designed for easy interpretation, offering a comprehensive visual interface:
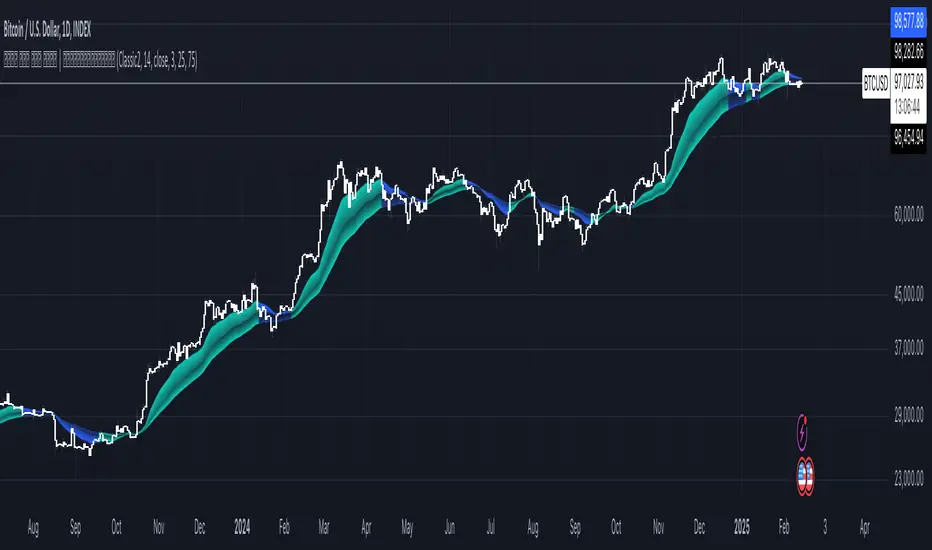
Green Bands: Represent a bullish trend when the score surpasses the positive threshold, indicating a potential long opportunity.
Red Bands: Represent a bearish trend when the score falls below the negative threshold, signaling a potential short opportunity. - Customization & Parameters
The DEMA RSI For Loop offers a wide range of customization options to fit various trading styles and strategies:
RSI Length: Default set to 14, adjusts the sensitivity of the RSI calculation.
DEMA Length: Default set to 5, controls the smoothing applied to the RSI.
Scoring Range (a, b): Defines the upper and lower bounds of the for-loop scoring system.
Color Modes: Choose from eight customizable color schemes to tailor the appearance of bullish and bearish signals. - Trading Applications
This indicator is highly versatile and can be applied to multiple trading strategies:
Trend Following: By combining DEMA and RSI, the indicator provides a lag-reduced trend analysis to confirm trend strength.
Reversal Detection: The scoring mechanism helps detect early signs of market reversals by highlighting shifts in momentum.
Risk Management: Clearly defined entry (long) and exit (short) signals help traders minimize risks and improve position management. - Final Note
Rocheur's DEMA RSI For Loop is a powerful tool for traders seeking precision and flexibility in their technical analysis. The combination of DEMA, RSI, and for-loop scoring provides a comprehensive view of market dynamics, enabling more informed trading decisions. As always, thorough backtesting and parameter adjustments are essential to tailor the indicator to your trading strategy. While no tool guarantees success, the DEMA RSI For Loop stands out as an innovative solution for modern traders looking to refine their approach to the markets.
發行說明
Added the alertcondition免責聲明
這些資訊和出版物並不意味著也不構成TradingView提供或認可的金融、投資、交易或其他類型的意見或建議。請在使用條款閱讀更多資訊。