OPEN-SOURCE SCRIPT
已更新 ChangeTrend [kingthies_]
% X Change Over Y Amount of Time
AKA "ChangeTrend"
Published by user Eric Thies [kingthies_] on 9/3/2020
Description
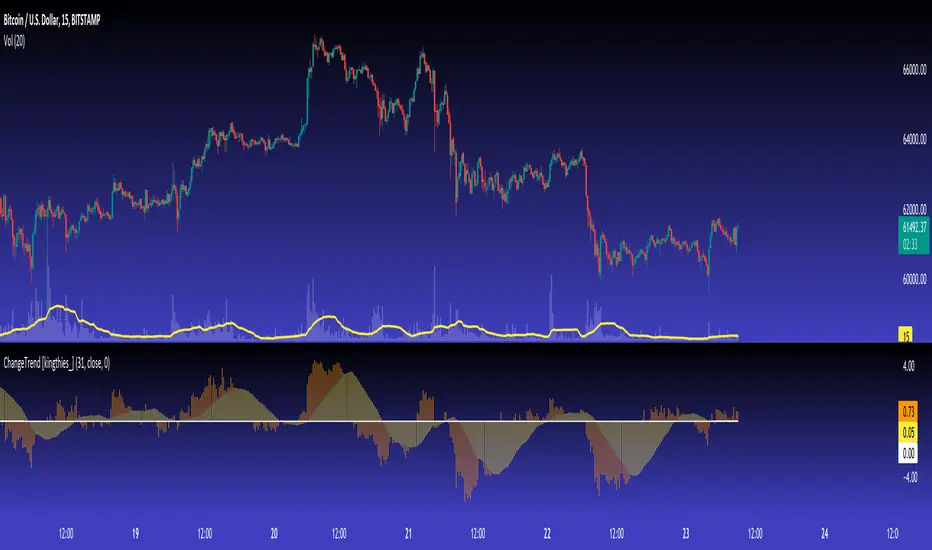
Relatively simple script that is measuring the performance of the input over the previous y # bars.
The EMA appears to make troughs and peaks easy to see coming / look at as they happen.
Interpretation:
Cheers,
AKA "ChangeTrend"
Published by user Eric Thies [kingthies_] on 9/3/2020
Description
Relatively simple script that is measuring the performance of the input over the previous y # bars.
The EMA appears to make troughs and peaks easy to see coming / look at as they happen.
Interpretation:
- Orange Histogram Represents the immediate % Change
- Yellow Histogram represents the overall trend of such as an SMA of the same Y # of bars.
Cheers,
發行說明
Upgraded to pine v5開源腳本
秉持TradingView一貫精神,這個腳本的創作者將其設為開源,以便交易者檢視並驗證其功能。向作者致敬!您可以免費使用此腳本,但請注意,重新發佈代碼需遵守我們的社群規範。
Eric Thies
免責聲明
這些資訊和出版物並非旨在提供,也不構成TradingView提供或認可的任何形式的財務、投資、交易或其他類型的建議或推薦。請閱讀使用條款以了解更多資訊。
開源腳本
秉持TradingView一貫精神,這個腳本的創作者將其設為開源,以便交易者檢視並驗證其功能。向作者致敬!您可以免費使用此腳本,但請注意,重新發佈代碼需遵守我們的社群規範。
Eric Thies
免責聲明
這些資訊和出版物並非旨在提供,也不構成TradingView提供或認可的任何形式的財務、投資、交易或其他類型的建議或推薦。請閱讀使用條款以了解更多資訊。