INVITE-ONLY SCRIPT
CandelaCharts - Macro Sentiment Index
📝 Overview
The Macro Sentiment Index (MSI) is a multi-asset, rules-based indicator designed to quantify global market risk appetite by aggregating signals from a diversified basket of financial instruments across equities, fixed income, commodities, currencies, volatility, and macroeconomic data.
Developed under the CandelaCharts framework, MSI transforms complex intermarket dynamics into a single, interpretable sentiment score. It reflects the collective behavior of institutional and retail investors, central bank policies, liquidity conditions, and macroeconomic trends.
Rather than relying on a single data source, the index combines over 30 components grouped into five core categories:
Each component is standardized using z-score normalization over a user-defined lookback period, weighted based on empirical significance, and aggregated into a composite sentiment score.
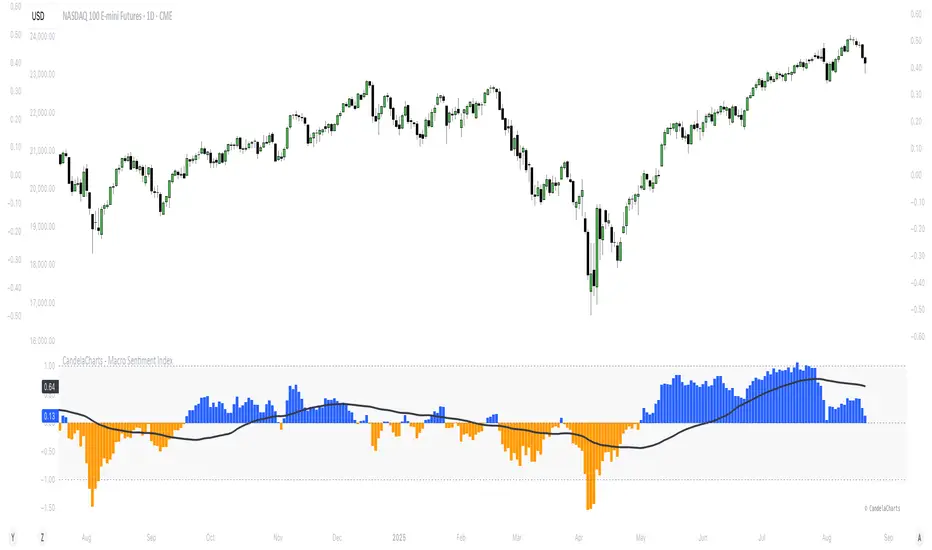
The final output oscillates around a neutral baseline (0), with positive values indicating risk-on conditions and negative values signaling risk-off sentiment.
📦 Features
⚙️ Settings
⚡️ Showcase
Default Mode

Area Mode

Smoothing Moving Average

📒 Usage
Interpreting the Index
🚨 Alerts
The indicator does not provide any alerts!
⚠️ Disclaimer
These tools are exclusively available on the TradingView platform.
Our charting tools are intended solely for informational and educational purposes and should not be regarded as financial, investment, or trading advice. They are not designed to predict market movements or offer specific recommendations. Users should be aware that past performance is not indicative of future results and should not rely on these tools for financial decisions. By using these charting tools, the purchaser agrees that the seller and creator hold no responsibility for any decisions made based on information provided by the tools. The purchaser assumes full responsibility and liability for any actions taken and their consequences, including potential financial losses or investment outcomes that may result from the use of these products.
By purchasing, the customer acknowledges and accepts that neither the seller nor the creator is liable for any undesired outcomes stemming from the development, sale, or use of these products. Additionally, the purchaser agrees to indemnify the seller from any liability. If invited through the Friends and Family Program, the purchaser understands that any provided discount code applies only to the initial purchase of Candela's subscription. The purchaser is responsible for canceling or requesting cancellation of their subscription if they choose not to continue at the full retail price. In the event the purchaser no longer wishes to use the products, they must unsubscribe from the membership service, if applicable.
We do not offer reimbursements, refunds, or chargebacks. Once these Terms are accepted at the time of purchase, no reimbursements, refunds, or chargebacks will be issued under any circumstances.
By continuing to use these charting tools, the user confirms their understanding and acceptance of these Terms as outlined in this disclaimer.
The Macro Sentiment Index (MSI) is a multi-asset, rules-based indicator designed to quantify global market risk appetite by aggregating signals from a diversified basket of financial instruments across equities, fixed income, commodities, currencies, volatility, and macroeconomic data.
Developed under the CandelaCharts framework, MSI transforms complex intermarket dynamics into a single, interpretable sentiment score. It reflects the collective behavior of institutional and retail investors, central bank policies, liquidity conditions, and macroeconomic trends.
Rather than relying on a single data source, the index combines over 30 components grouped into five core categories:
- Risk-On Assets
- Risk-Off / Defensive Assets
- Macro & Interest Rate Indicators
- Central Bank & Policy Proxies
- Sentiment Ratios & Cross-Asset Signals
Each component is standardized using z-score normalization over a user-defined lookback period, weighted based on empirical significance, and aggregated into a composite sentiment score.
The final output oscillates around a neutral baseline (0), with positive values indicating risk-on conditions and negative values signaling risk-off sentiment.
📦 Features
- Multi-Dimensional Inputs: Integrates equities, bonds, commodities, volatility, FX, yield curves, policy, macro, sector rotations, and sentiment ratios for holistic market breadth.
- Adaptive Scoring System: Converts inputs into z-scores over a lookback window, normalizes directionality, and highlights relative strength/weakness in real time.
- Weighted Aggregation: Users assign custom weights (0.1–3.0) to inputs, enabling fine-tuning for regimes or strategies. The index is a weighted average of component scores.
- Smoothing & Visualization Modes: Apply SMA, EMA, RMA, or VWMA with custom length. Display as line, histogram, area, or columns with neutral, overbought, and oversold zones.
- Correlation Monitoring: On-chart table tracks rolling correlations (default 20 periods) between asset prices and MSI, detecting divergences and regime changes.
- Customizable UI: Personalize fonts, text size, branding, and color schemes for bullish/bearish phases and MA line visualization.
⚙️ Settings
- Lookback: Define how far back the indicator evaluates data
- MA (Moving Average): When enabled, overlays a moving default disabled
- MA Smoothing: Applies a secondary smoothing layer
- Correlation: Defines the period over which correlation is measured
- Mode: Determines the visual layout style
- Equity Benchmarks: SPY, QQQ, IWM, EEM
- Fixed Income: TLT, HYG, LQD, SHY
- Commodities: Gold (GC), Copper (HG), Oil (CL), BCOM
- Volatility: VIX, VVIX, MOVE, SKEW
- FX Pairs: USD/JPY, USD/CHF, AUD/JPY, DXY
- Yield Curves: 10Y-2Y Spread (TYX), 10Y-5Y (TNX-FEDFUNDS)
- Monetary Policy: SOFR, ED, FF futures
- Global Macro: BDIY, M2, TED Spread, Put/Call Ratio
- Sector Rotation: XLU/XLY, XLY/XLP
- Sentiment Ratios: SPY/TLT, HYG/LQD, BTC/Gold, Copper/Gold, etc
⚡️ Showcase
Default Mode
Area Mode
Smoothing Moving Average
📒 Usage
Interpreting the Index
- Above 0: Net risk-on sentiment - (Markets favor growth, liquidity, and speculative assets)
- Below 0: Net risk-off sentiment - (Flight to safety, rising volatility, defensive positioning)
- Above +1: Extreme risk-on / complacency - (Potential overheating or topping pattern)
- Below −1: Extreme risk-off / fear - (Stress, capitulation, or strong defensive rotation)
🚨 Alerts
The indicator does not provide any alerts!
⚠️ Disclaimer
These tools are exclusively available on the TradingView platform.
Our charting tools are intended solely for informational and educational purposes and should not be regarded as financial, investment, or trading advice. They are not designed to predict market movements or offer specific recommendations. Users should be aware that past performance is not indicative of future results and should not rely on these tools for financial decisions. By using these charting tools, the purchaser agrees that the seller and creator hold no responsibility for any decisions made based on information provided by the tools. The purchaser assumes full responsibility and liability for any actions taken and their consequences, including potential financial losses or investment outcomes that may result from the use of these products.
By purchasing, the customer acknowledges and accepts that neither the seller nor the creator is liable for any undesired outcomes stemming from the development, sale, or use of these products. Additionally, the purchaser agrees to indemnify the seller from any liability. If invited through the Friends and Family Program, the purchaser understands that any provided discount code applies only to the initial purchase of Candela's subscription. The purchaser is responsible for canceling or requesting cancellation of their subscription if they choose not to continue at the full retail price. In the event the purchaser no longer wishes to use the products, they must unsubscribe from the membership service, if applicable.
We do not offer reimbursements, refunds, or chargebacks. Once these Terms are accepted at the time of purchase, no reimbursements, refunds, or chargebacks will be issued under any circumstances.
By continuing to use these charting tools, the user confirms their understanding and acceptance of these Terms as outlined in this disclaimer.
僅限邀請腳本
僅作者批准的使用者才能訪問此腳本。您需要申請並獲得使用許可,通常需在付款後才能取得。更多詳情,請依照作者以下的指示操作,或直接聯絡CandelaCharts。
TradingView不建議在未完全信任作者並了解其運作方式的情況下購買或使用腳本。您也可以在我們的社群腳本中找到免費的開源替代方案。
作者的說明
Explore all CandelaCharts indicators at: https://www.candelacharts.com/. Connect with our community on Discord: https://discord.gg/etGSTepqbu. All scripts and content provided by CandelaCharts are intended for informational and educational purposes only.
Get access to our exclusive tools: candelacharts.com
Join our community: discord.gg/etGSTepqbu
All content provided by CandelaCharts is for informational & educational purposes only.
Join our community: discord.gg/etGSTepqbu
All content provided by CandelaCharts is for informational & educational purposes only.
免責聲明
這些資訊和出版物並非旨在提供,也不構成TradingView提供或認可的任何形式的財務、投資、交易或其他類型的建議或推薦。請閱讀使用條款以了解更多資訊。