OPEN-SOURCE SCRIPT
已更新 Color Changing Moving Average
Hello everybody!
I'm not much of a coder but I do make indicators for myself for fun sometimes and found this one super cool. Hope it helps!
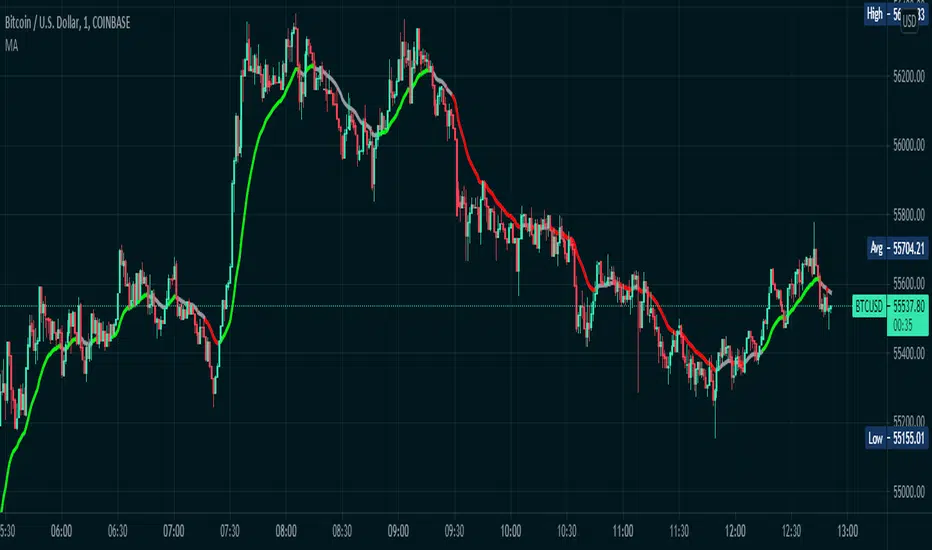
Basically it's a moving average that changes colors based on the trend. How does it do it, you may ask? Simply put, it checks and makes sure that the open and close price is above the moving average, then it checks and sees if the 50-period RSI (length adjustable) is above 50. If both conditions are met, the moving average turns green. Simple as that.
If the price is below the moving average and the RSI is below 50, the moving average turns red.
If the price is above the moving average but the RSI is below 50, the line is grey and I advise to simply waiting for the trend direction to be decided. Likewise, if the price is below the moving average, but the RSI is above 50, the line is also grey.
This is NOT a comprehensive system, and the changing color of the moving average does not indicate a buy or sell signal. It simply indicates that the price is trending. You should use your own entry and exit strategy, such as the MACD, Wave Trend, Schaff Trend Cycle, etc.
As well, I would recommend waiting for confirmation of a trend change when the color changes, since in a range price can cross multiple times before deciding on the right direction.
The slope of the moving average can help too, since in a range the moving average is typically flat.
I would recommend using a fixed risk to reward ratio, to limit emotions. But, this would also help with a trend-following strategy due to the trend filter functionality.
The length of the moving average is adjustable, as well as the RSI period- though I wouldn't recommend selecting an RSI lower than 30 because it will whipsaw more. Disabling the EMA option will give you an SMA that does the same thing as the EMA. You can also disable the RSI filter and simply have a moving average that changes color when the price is above/below- but that's pretty boring, huh?
Anyways, hope this helps, happy trading everybody :)
發行說明
Fixed the offset function so it actually works發行說明
Made the colors brighter發行說明
Added alert condition發行說明
Added Alert for when the line turns grey (MA Buy = line is green, MA Sell = line is red, and MA Cancel Buy/Sell = the line has turned grey)發行說明
Changed demonstration ticker開源腳本
秉持TradingView一貫精神,這個腳本的創作者將其設為開源,以便交易者檢視並驗證其功能。向作者致敬!您可以免費使用此腳本,但請注意,重新發佈代碼需遵守我們的社群規範。
免責聲明
這些資訊和出版物並非旨在提供,也不構成TradingView提供或認可的任何形式的財務、投資、交易或其他類型的建議或推薦。請閱讀使用條款以了解更多資訊。
開源腳本
秉持TradingView一貫精神,這個腳本的創作者將其設為開源,以便交易者檢視並驗證其功能。向作者致敬!您可以免費使用此腳本,但請注意,重新發佈代碼需遵守我們的社群規範。
免責聲明
這些資訊和出版物並非旨在提供,也不構成TradingView提供或認可的任何形式的財務、投資、交易或其他類型的建議或推薦。請閱讀使用條款以了解更多資訊。