PROTECTED SOURCE SCRIPT
TONYLASUERTE
Indicator Description
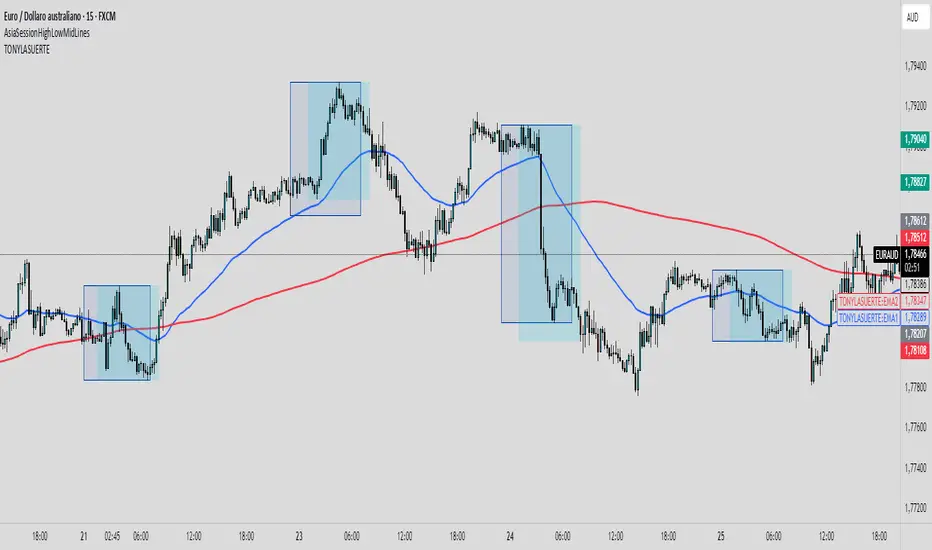
This indicator is designed to provide a clear market reading by combining trend analysis, low-activity zones, and potential reaction signals:
- Moving Averages (50 and 200 periods): the 50-period (blue) and 200-period (red) moving averages help define the overall market trend while also acting as dynamic support and resistance levels. Their alignment or crossover serves as a key signal for assessing market strength.
- Asian Session Highlighting: the indicator marks rectangles over the Asian session ranges, a phase typically characterized by low volatility and tight ranges. This helps avoid trading in low-interest conditions and focus on more liquid phases.
- Post-Asia Reactions: the imbalance occurring after the Asian session is highlighted, making it easier to spot potential breakout points and the start of directional moves.
- Divergent Candles (visual signals): divergence candles are highlighted with different colors. When combined with the moving averages and the post-Asia imbalance, they can anticipate possible reversals or confirm trend continuation.
📌 Indicator Objective: filter out low-quality trading phases, highlight key reaction zones, and improve entry timing by leveraging the interaction between trend (moving averages), divergences, and post-Asian session dynamics.
受保護腳本
此腳本以閉源形式發佈。 不過,您可以自由使用,沒有任何限制 — 點擊此處了解更多。
免責聲明
這些資訊和出版物並非旨在提供,也不構成TradingView提供或認可的任何形式的財務、投資、交易或其他類型的建議或推薦。請閱讀使用條款以了解更多資訊。
受保護腳本
此腳本以閉源形式發佈。 不過,您可以自由使用,沒有任何限制 — 點擊此處了解更多。
免責聲明
這些資訊和出版物並非旨在提供,也不構成TradingView提供或認可的任何形式的財務、投資、交易或其他類型的建議或推薦。請閱讀使用條款以了解更多資訊。