OPEN-SOURCE SCRIPT
Upvol and Downvol
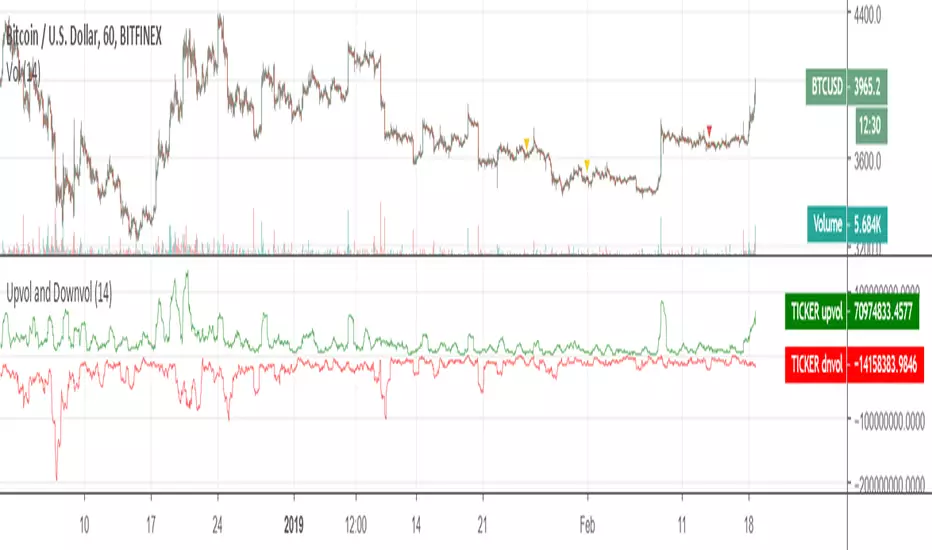
Upvolume and downvolume, calculated according to the MFI (Money Flow) formula, and shown separately.
The indicator has options for also showing NYSE upvolume and downvolume or ES1! (S&P500 upvolume/downvolume) along with the main ticker data, so you can compare them.
The chart can be analyzed by drawing trend lines, and can be surprisingly accurate.
~
The indicator has options for also showing NYSE upvolume and downvolume or ES1! (S&P500 upvolume/downvolume) along with the main ticker data, so you can compare them.
The chart can be analyzed by drawing trend lines, and can be surprisingly accurate.
~
開源腳本
秉持TradingView一貫精神,這個腳本的創作者將其設為開源,以便交易者檢視並驗證其功能。向作者致敬!您可以免費使用此腳本,但請注意,重新發佈代碼需遵守我們的社群規範。
免責聲明
這些資訊和出版物並非旨在提供,也不構成TradingView提供或認可的任何形式的財務、投資、交易或其他類型的建議或推薦。請閱讀使用條款以了解更多資訊。
免責聲明
這些資訊和出版物並非旨在提供,也不構成TradingView提供或認可的任何形式的財務、投資、交易或其他類型的建議或推薦。請閱讀使用條款以了解更多資訊。