OPEN-SOURCE SCRIPT
已更新 Madrid MA Ribbon Bar
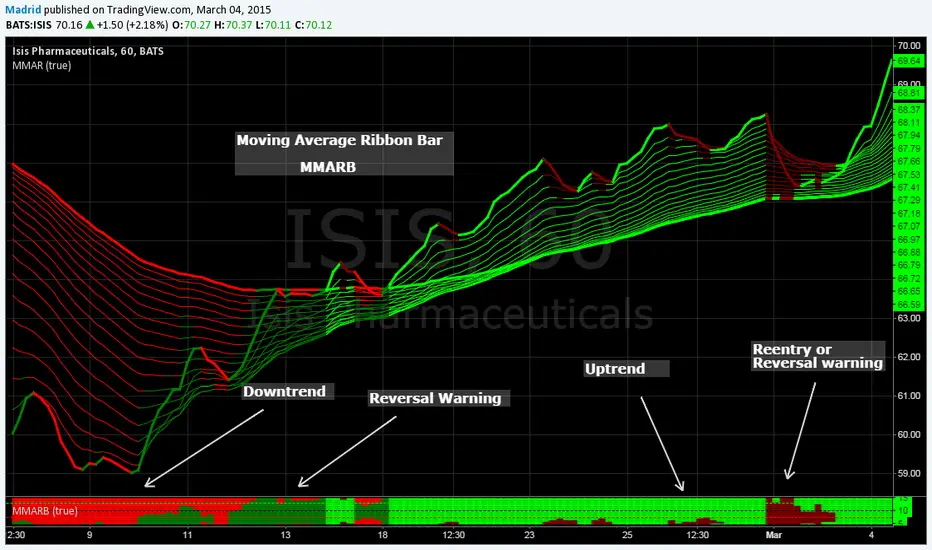
This is the MMAR companion study. This along with the MMAR study help visualize in a concise way the trend direction, patterns, trend strength, entry points and reversals.
Trading with MMAR: Look for the size of the bar, when it is partially filled with a color starting from bottom to top it means there is a reentry point, but if it fills 50% or more then there is a strong possibility that this will turn into a trend reversal. You may want to wait for confirmation. Normally after two or three solid bars you can have an idea of where the trend goes.
The standard colors are
1. Red : Downtrend
2. Maroon : Short reentry or uptrend warning
3. Lime : Uptrend
4. Green : Long reentry or downtrend warning
This indicator is based on the MMAR, so the only parameter it needs is the kind of MA you want to use, if you're using a regular standard moving average or an exponential moving average (this reduces lagging). Normally I use the exponential MA, which is the default value. It is simple, it only has four output values, it can be easily interpreted and practically no input parameters to tune. This doesn't require too much space on the screen
I suggest you to shrink the bar so it gives the visual effect of a solid bar and put it at the bottom of the screen.
發行說明
Upgrade from PSv1 to PSv6開源腳本
本著TradingView的真正精神,此腳本的創建者將其開源,以便交易者可以查看和驗證其功能。向作者致敬!雖然您可以免費使用它,但請記住,重新發佈程式碼必須遵守我們的網站規則。
免責聲明
這些資訊和出版物並不意味著也不構成TradingView提供或認可的金融、投資、交易或其他類型的意見或建議。請在使用條款閱讀更多資訊。
開源腳本
本著TradingView的真正精神,此腳本的創建者將其開源,以便交易者可以查看和驗證其功能。向作者致敬!雖然您可以免費使用它,但請記住,重新發佈程式碼必須遵守我們的網站規則。
免責聲明
這些資訊和出版物並不意味著也不構成TradingView提供或認可的金融、投資、交易或其他類型的意見或建議。請在使用條款閱讀更多資訊。