INVITE-ONLY SCRIPT
已更新 Z Momentum
Overview
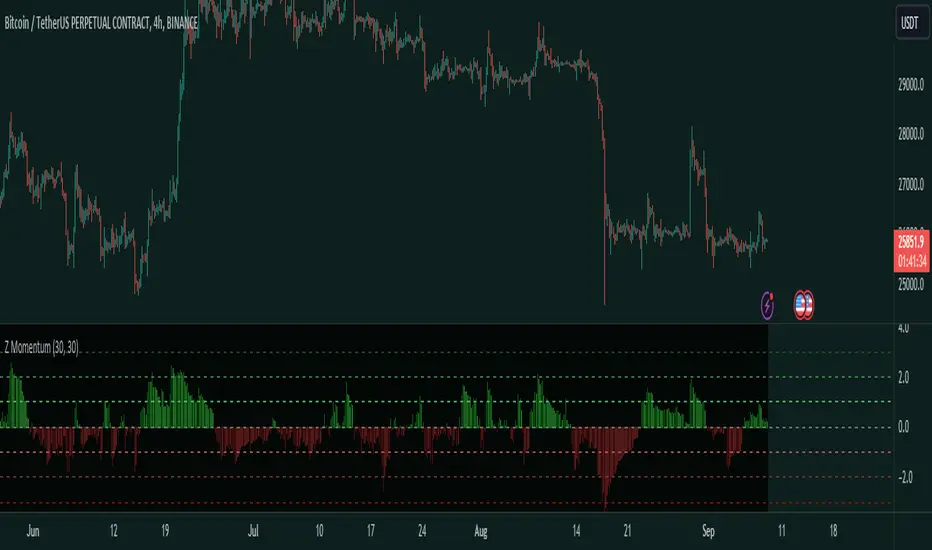
This is a Z-Scored Momentum Indicator. It allows you to understand the volatility of a financial instrument. This indicator calculates and displays the momentum of z-score returns expected value which can be used for finding the regime or for trading inefficiencies.
Indicator Purpose:
The primary purpose of the "Z-Score Momentum" indicator is to help traders identify potential trading opportunities by assessing how far the current returns of a financial instrument deviate from their historical mean returns. This analysis can aid in recognizing overbought or oversold conditions, trend strength, and potential reversal points.
Things to note:[\b]
A Z-Score is a measure of how many standard deviations a data point is away from the mean.
EV: Expected Value, which is basically the average outcome.
When the Z-Score Momentum is above 0, there is a positive Z-Score which indicates that the current returns of the financial instrument are above their historical mean returns over the specified return lookback period, which could mean Positive, Momentum, and in a extremely high Z-Score value, like above +2 Standard deviations it could indicate extreme conditions, but keep in mind this doesn't mean price will go down, this is just the EV.
When the Z-Score Momentum is below 0, there is negative Z-Score which indicates that the current returns of the financial instrument are below their historical mean returns which means you could expect negative returns. In extreme Z-Score situations like -2 Standard deviations this could indicate extreme conditions and the negative momentum is coming to an end.
TDLR:
Interpretation:
The lines on the Indicator highlight the Standard deviations of the Z-Score. It shows the Standard deviations 1,2,3 and -1,-2,-3.


This is a Z-Scored Momentum Indicator. It allows you to understand the volatility of a financial instrument. This indicator calculates and displays the momentum of z-score returns expected value which can be used for finding the regime or for trading inefficiencies.
Indicator Purpose:
The primary purpose of the "Z-Score Momentum" indicator is to help traders identify potential trading opportunities by assessing how far the current returns of a financial instrument deviate from their historical mean returns. This analysis can aid in recognizing overbought or oversold conditions, trend strength, and potential reversal points.
Things to note:[\b]
A Z-Score is a measure of how many standard deviations a data point is away from the mean.
EV: Expected Value, which is basically the average outcome.
When the Z-Score Momentum is above 0, there is a positive Z-Score which indicates that the current returns of the financial instrument are above their historical mean returns over the specified return lookback period, which could mean Positive, Momentum, and in a extremely high Z-Score value, like above +2 Standard deviations it could indicate extreme conditions, but keep in mind this doesn't mean price will go down, this is just the EV.
When the Z-Score Momentum is below 0, there is negative Z-Score which indicates that the current returns of the financial instrument are below their historical mean returns which means you could expect negative returns. In extreme Z-Score situations like -2 Standard deviations this could indicate extreme conditions and the negative momentum is coming to an end.
TDLR:
Interpretation:
- Positive Z-Score: When the Z-score is positive and increasing, it suggests that current returns are above their historical mean, indicating potential positive momentum.
- Negative Z-Score: Conversely, a negative and decreasing Z-score implies that current returns are below their historical mean, suggesting potential negative momentum.
- Extremely High or Low Z-Score: Extremely high (above +2) or low (below -2) Z-scores may indicate extreme market conditions that could be followed by reversals or significant price movements.
The lines on the Indicator highlight the Standard deviations of the Z-Score. It shows the Standard deviations 1,2,3 and -1,-2,-3.
發行說明
Description Update僅限邀請腳本
僅作者批准的使用者才能訪問此腳本。您需要申請並獲得使用許可,通常需在付款後才能取得。更多詳情,請依照作者以下的指示操作,或直接聯絡Traders_Endeavors。
TradingView不建議在未完全信任作者並了解其運作方式的情況下購買或使用腳本。您也可以在我們的社群腳本中找到免費的開源替代方案。
作者的說明
Get access here: https://www.patreon.com/user?u=80987417
Link Tree: linktr.ee/tradersendeavors
Access our indicators: patreon.com/user?u=80987417
Access our indicators: patreon.com/user?u=80987417
免責聲明
這些資訊和出版物並非旨在提供,也不構成TradingView提供或認可的任何形式的財務、投資、交易或其他類型的建議或推薦。請閱讀使用條款以了解更多資訊。
僅限邀請腳本
僅作者批准的使用者才能訪問此腳本。您需要申請並獲得使用許可,通常需在付款後才能取得。更多詳情,請依照作者以下的指示操作,或直接聯絡Traders_Endeavors。
TradingView不建議在未完全信任作者並了解其運作方式的情況下購買或使用腳本。您也可以在我們的社群腳本中找到免費的開源替代方案。
作者的說明
Get access here: https://www.patreon.com/user?u=80987417
Link Tree: linktr.ee/tradersendeavors
Access our indicators: patreon.com/user?u=80987417
Access our indicators: patreon.com/user?u=80987417
免責聲明
這些資訊和出版物並非旨在提供,也不構成TradingView提供或認可的任何形式的財務、投資、交易或其他類型的建議或推薦。請閱讀使用條款以了解更多資訊。