OPEN-SOURCE SCRIPT
Democratic Fibonacci Moving Averages
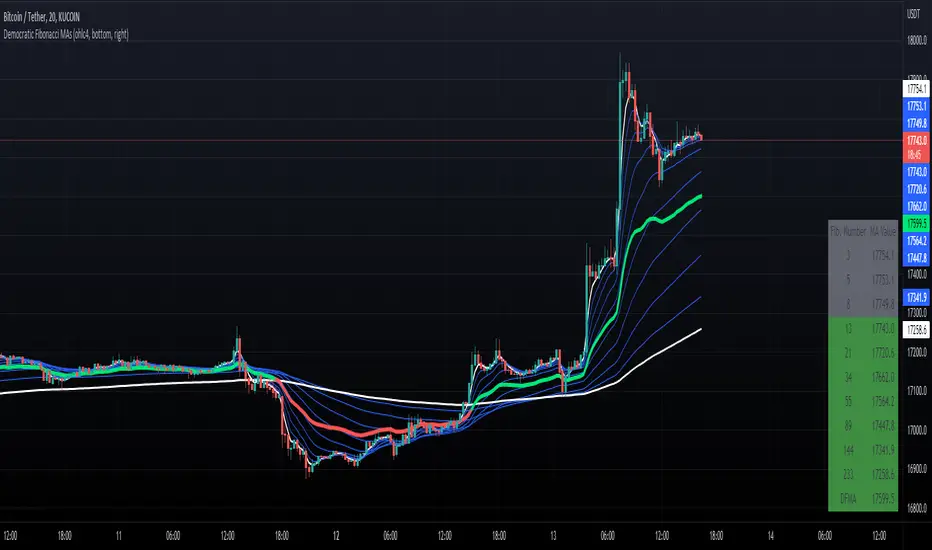
With this indicator, we have taken moving averages at Fibonacci lengths (3 to 233) as well as the average of these values, labeled the DFMA. Additionally, these values have been inputted into a table overlay. The cross of the FibMA(233) and the DFMA can be used as a signal for long or short.
The FibMA lengths of 3 and 233 are plotted in white by default, the FibMAs with lengths between 3 and 233 are plotted in blue by default, and the democratic line (DFMA) that averages these lines is plotted in green or red (depending on if the value is above or below the 233-length FibMA).
The FibMA lengths of 3 and 233 are plotted in white by default, the FibMAs with lengths between 3 and 233 are plotted in blue by default, and the democratic line (DFMA) that averages these lines is plotted in green or red (depending on if the value is above or below the 233-length FibMA).
開源腳本
秉持TradingView一貫精神,這個腳本的創作者將其設為開源,以便交易者檢視並驗證其功能。向作者致敬!您可以免費使用此腳本,但請注意,重新發佈代碼需遵守我們的社群規範。
免責聲明
這些資訊和出版物並非旨在提供,也不構成TradingView提供或認可的任何形式的財務、投資、交易或其他類型的建議或推薦。請閱讀使用條款以了解更多資訊。
免責聲明
這些資訊和出版物並非旨在提供,也不構成TradingView提供或認可的任何形式的財務、投資、交易或其他類型的建議或推薦。請閱讀使用條款以了解更多資訊。