INVITE-ONLY SCRIPT
felci
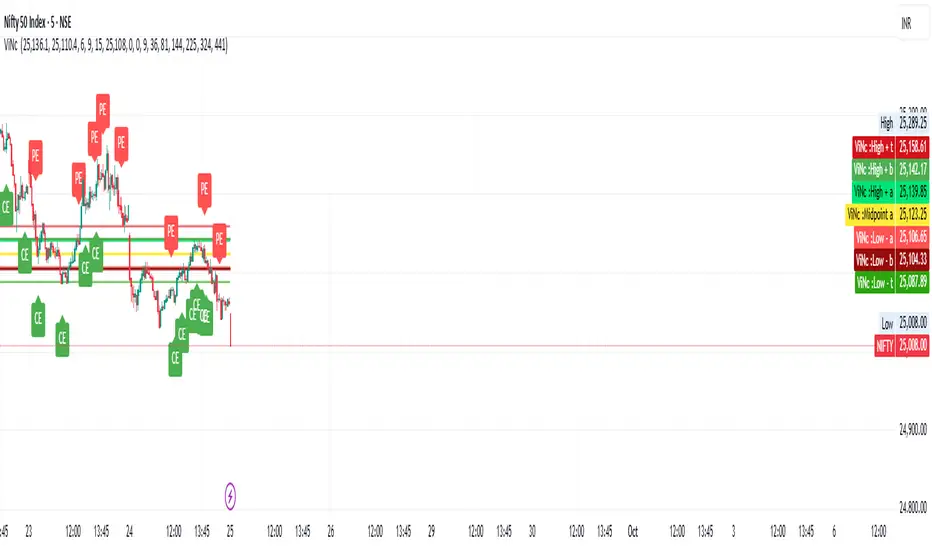
The first row shows HIGH values of NIFTY.
The second row shows LOW values of NIFTY.
Some values are negative (like -2058, -300, -486)—these could indicate changes or differences rather than absolute index values.
The table seems color-coded in the image: green, orange, and light colors—probably to highlight ranges or thresholds.
The second row shows LOW values of NIFTY.
Some values are negative (like -2058, -300, -486)—these could indicate changes or differences rather than absolute index values.
The table seems color-coded in the image: green, orange, and light colors—probably to highlight ranges or thresholds.
僅限邀請腳本
僅作者批准的使用者才能訪問此腳本。您需要申請並獲得使用許可,通常需在付款後才能取得。更多詳情,請依照作者以下的指示操作,或直接聯絡vincent_march88。
TradingView不建議在未完全信任作者並了解其運作方式的情況下購買或使用腳本。您也可以在我們的社群腳本中找到免費的開源替代方案。
作者的說明
give request and pay 1 month subscription
免責聲明
這些資訊和出版物並非旨在提供,也不構成TradingView提供或認可的任何形式的財務、投資、交易或其他類型的建議或推薦。請閱讀使用條款以了解更多資訊。
僅限邀請腳本
僅作者批准的使用者才能訪問此腳本。您需要申請並獲得使用許可,通常需在付款後才能取得。更多詳情,請依照作者以下的指示操作,或直接聯絡vincent_march88。
TradingView不建議在未完全信任作者並了解其運作方式的情況下購買或使用腳本。您也可以在我們的社群腳本中找到免費的開源替代方案。
作者的說明
give request and pay 1 month subscription
免責聲明
這些資訊和出版物並非旨在提供,也不構成TradingView提供或認可的任何形式的財務、投資、交易或其他類型的建議或推薦。請閱讀使用條款以了解更多資訊。