OPEN-SOURCE SCRIPT
已更新 MTF Trend Truth [Hubka]
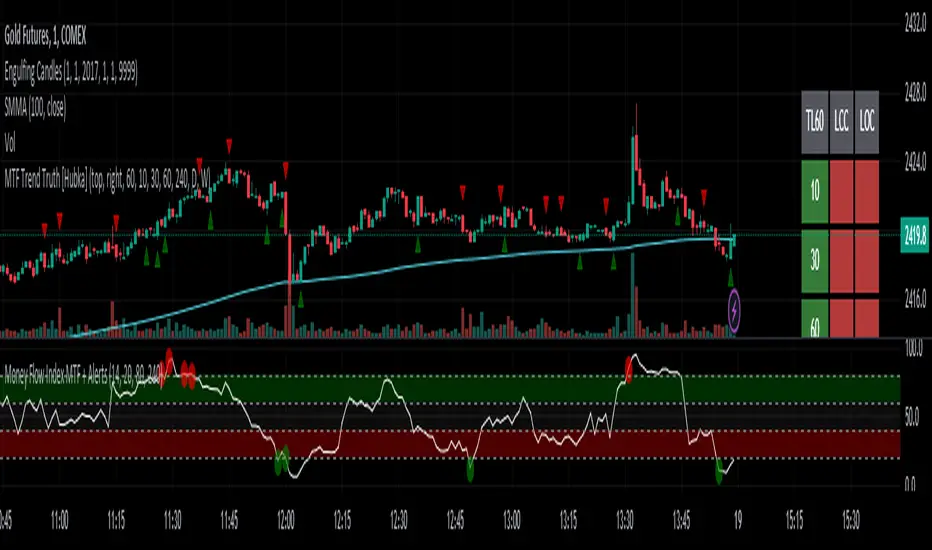
A Multi Time Frame Tend table that displays symbols trends for 6 selectable Time Intervals. In addition to the 6 first row color trends, the table also displays the direction of the last 2 candles in each Time Interval in the last 2 rows. This extra interval information displays price trend direction change or may add confluence if the price direction is the same.
The top row of the table has column header names described below:
(TL30) Column 1 - Trend Interval + The Trend Length selected (30 is default). Uses the last 30 candles to determine the trend for this interval. The length number is Editable.
(LCC) Column 2 - Last Closed Candle. This is the direction color of the second last candle on the chart.
(LOC) Column 3 - Last Open Candle. The is the current candle color direction of the last candle on the chart. This candle has not yet closed and will flicker as price changing state.
NOTE 1: (LOC) Column 3 - Last Open Candle - only displays correctly when the market is open and price is changing.
You can adjust the "Trend Length in Candles" which defaults to using the trend of the last 30 candles (TL30). Edit this setting to use any number from 5 to 99 candles back if you want display different trend lengths.
Having a visual table of the price trends from different time intervals can be beneficial to traders. For example... When observing that a symbol has many Bullish (green) price trends on several time intervals and the last 2 candles are also bullish it should afford a trader confluence to trade in that same bullish direction. However I am not a professional and do not offer any trading advice in any way. Use this indicator at your own risk.
NOTE 2: Time interval of 240 = 4 hours. Below 1 day number only is minutes.
發行說明
UPD: Change color transparency so table views better with white chart background.Change default trendLength default value from 30 to 60
開源腳本
本著TradingView的真正精神,此腳本的創建者將其開源,以便交易者可以查看和驗證其功能。向作者致敬!雖然您可以免費使用它,但請記住,重新發佈程式碼必須遵守我們的網站規則。
免責聲明
這些資訊和出版物並不意味著也不構成TradingView提供或認可的金融、投資、交易或其他類型的意見或建議。請在使用條款閱讀更多資訊。
開源腳本
本著TradingView的真正精神,此腳本的創建者將其開源,以便交易者可以查看和驗證其功能。向作者致敬!雖然您可以免費使用它,但請記住,重新發佈程式碼必須遵守我們的網站規則。
免責聲明
這些資訊和出版物並不意味著也不構成TradingView提供或認可的金融、投資、交易或其他類型的意見或建議。請在使用條款閱讀更多資訊。