OPEN-SOURCE SCRIPT
NVT Signal with RMA and thresholds [alertable]
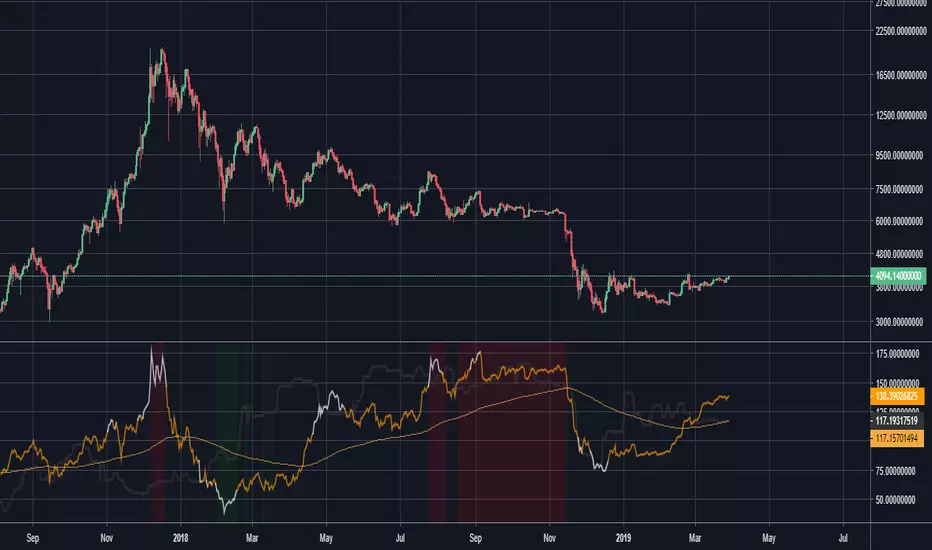
NVT Signal, or NVTS, is an indicator that compares the market cap of Bitcoin to the aggregate USD value of daily transactions on the Bitcoin blockchain. It is a value indicator that shows a multiple of Bitcoin price against the actual usage of its blockchain. When the NVTS is low, it suggests Bitcoin price is low relative to the amount of utility the network provides, and vice versa.
For more information on NVTS, visit medium.com/cryptolab/https-medium-com-kalichkin-rethinking-nvt-ratio-2cf810df0ab0
This indicator aims to provide the following:
1. An open-source implementation of NVTS on Tradingview, as the most popular one currently is closed-source.
2. To provide two simple ways to define and visualize "overbought" or "oversold" conditions using the NVTS. Here, we have absolute value of NVTS & deviation from a long-term moving average.
3. Crude integration into Tradingview's alert system.
What this indicator CANNOT do:
1. Timeframes below 1d.
2. Signals based on statistical analyses, such as seen in Bollinger Bands et al. (However, with the appropriate type of account, you can add BBands on top of this indicator.)
I would like to express my gratitude to Willy Woo, Chris Burniske and Dimitry Kalichkin for their work on NVT Ratio and NVT Signal, without which my indicator would not have been created.
Feel free to fork & improve, or experiment with settings. I hope this indicator will be useful to someone.
開源腳本
本著TradingView的真正精神,此腳本的創建者將其開源,以便交易者可以查看和驗證其功能。向作者致敬!雖然您可以免費使用它,但請記住,重新發佈程式碼必須遵守我們的網站規則。
免責聲明
這些資訊和出版物並不意味著也不構成TradingView提供或認可的金融、投資、交易或其他類型的意見或建議。請在使用條款閱讀更多資訊。
免責聲明
這些資訊和出版物並不意味著也不構成TradingView提供或認可的金融、投資、交易或其他類型的意見或建議。請在使用條款閱讀更多資訊。