PROTECTED SOURCE SCRIPT
Traders Trend Strategy
Trader's Trend
This indicator basicly using 4 different calculations average.
And you can see this average as line on this script.
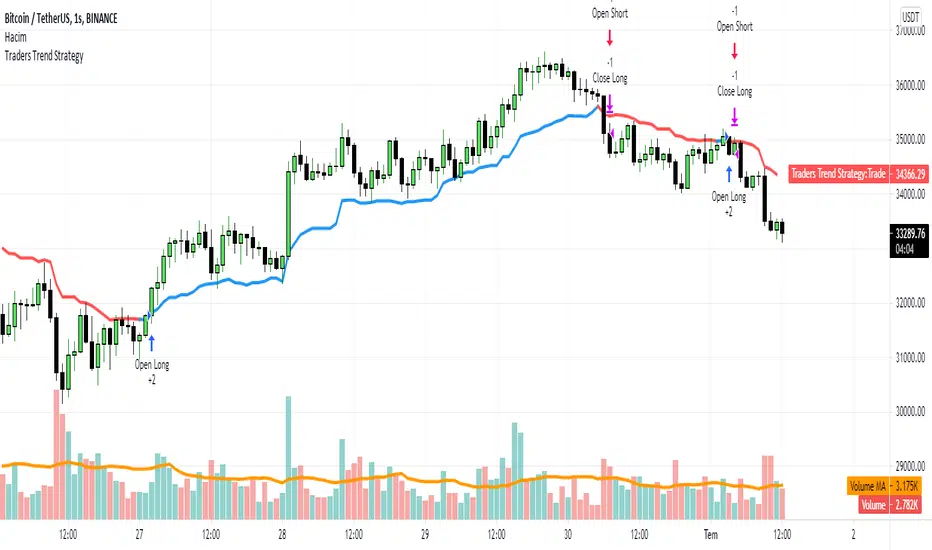
This line has 2 functions
1. Buy and Sell Strategy
-İf the line colored BLUE this means you can BUY (Long)
-İf the line colored RED this means you can SELL (Short)

As you can see the picture you can buy-sell and long-short with this line
2. Support and Resistance Function
You can use the line as resistance and support.
You can see when you can LONG and when you can SHORT with this strategy.
This indicator basicly using 4 different calculations average.
And you can see this average as line on this script.
This line has 2 functions
1. Buy and Sell Strategy
-İf the line colored BLUE this means you can BUY (Long)
-İf the line colored RED this means you can SELL (Short)
As you can see the picture you can buy-sell and long-short with this line
2. Support and Resistance Function
You can use the line as resistance and support.
You can see when you can LONG and when you can SHORT with this strategy.
受保護腳本
此腳本以閉源形式發佈。 不過,您可以自由使用,沒有任何限制 — 點擊此處了解更多。
免責聲明
這些資訊和出版物並非旨在提供,也不構成TradingView提供或認可的任何形式的財務、投資、交易或其他類型的建議或推薦。請閱讀使用條款以了解更多資訊。
受保護腳本
此腳本以閉源形式發佈。 不過,您可以自由使用,沒有任何限制 — 點擊此處了解更多。
免責聲明
這些資訊和出版物並非旨在提供,也不構成TradingView提供或認可的任何形式的財務、投資、交易或其他類型的建議或推薦。請閱讀使用條款以了解更多資訊。