OPEN-SOURCE SCRIPT
Goethe B - Mutiple Leading Indicator Package
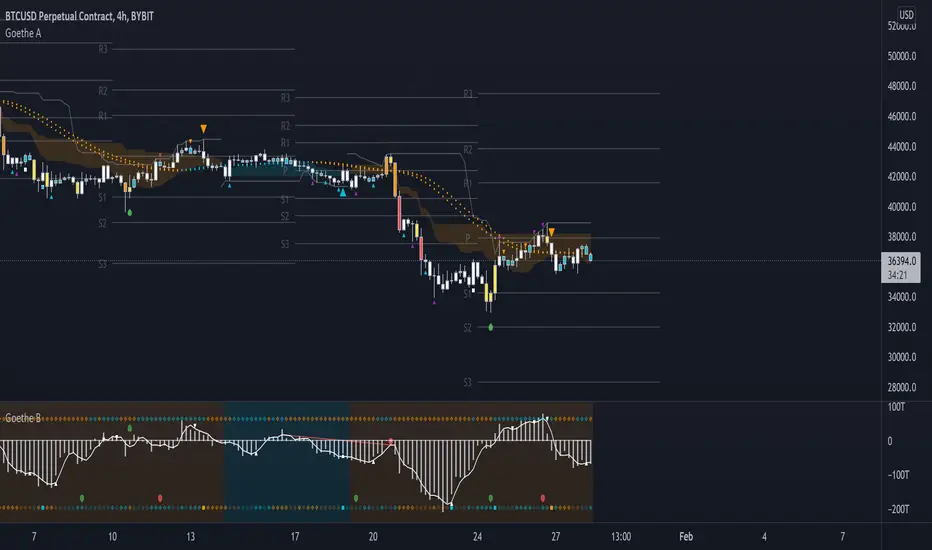
Goethe B is an Indicator Package that contains multiple leading and lagging indicators.
The background is that shows the local trend is calculated by either two Moving Averages or by a Kumo Cloud. By default the Kumo Cloud calculation is used.
What is the main oscillator?
- The main oscillator is TSV, or time segmented volume. It is one of the more interesting leading indicators.
What is the top bar?
-The top bar shows a trend confirmation based on the wolfpack ID indicator.
What are those circles on the second top bar?
-Those are Divergences of an internally calculated PVT oscillator. Red for Regular-Bearish, Green for Regular-Bullish.
What are those circles on the main oscillator?
-These are Divergences. Red for Regular-Bearish. Orange for Hidden-Bearish. Green for Regular-Bullish. Aqua for Hidden-Bullish.
What are those circles on the second lower bar?
-Those are Divergences of an internally calculated CCI indicator. Red for Regular-Bearish, Green for Regular-Bullish.
What is the lower bar?
-The lower bar shows a trend confirmation based on the Acceleration Oscillator, in best case it showes how far in the trend the current price action is.
What are those orange or aqua squares?
- These are TSI (true strength indicator) entry signals . They are calculated by the TSI entry signal, the TSI oscillator threshold.
Most settings of the indicator package can be modified to your liking and based on your chosen strategy might have to be modified. Please keep in mind that this indicator is a tool and not a strategy, do not blindly trade signals, do your own research first! Use this indicator in conjunction with other indicators to get multiple confirmations.
開源腳本
秉持TradingView一貫精神,這個腳本的創作者將其設為開源,以便交易者檢視並驗證其功能。向作者致敬!您可以免費使用此腳本,但請注意,重新發佈代碼需遵守我們的社群規範。
免責聲明
這些資訊和出版物並非旨在提供,也不構成TradingView提供或認可的任何形式的財務、投資、交易或其他類型的建議或推薦。請閱讀使用條款以了解更多資訊。
開源腳本
秉持TradingView一貫精神,這個腳本的創作者將其設為開源,以便交易者檢視並驗證其功能。向作者致敬!您可以免費使用此腳本,但請注意,重新發佈代碼需遵守我們的社群規範。
免責聲明
這些資訊和出版物並非旨在提供,也不構成TradingView提供或認可的任何形式的財務、投資、交易或其他類型的建議或推薦。請閱讀使用條款以了解更多資訊。