INVITE-ONLY SCRIPT
LT Pro-Divergence 2.0
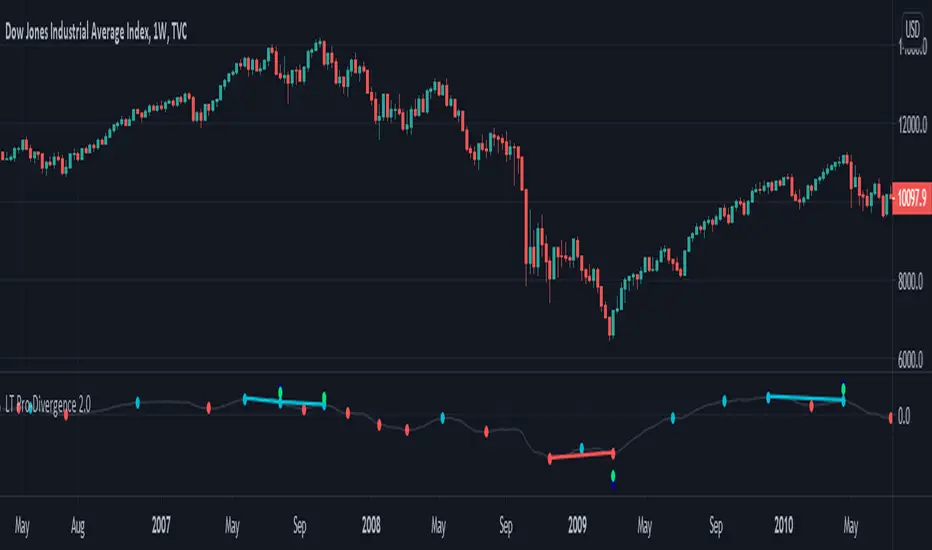
This indicator can visually show the divergences on the chart – i.e. a divergence between price action and the momentum. So for example, when price makes a new low and the momentum does not make a new low, this is often a “bullish” divergence – indicating that the force of the downtrend could be weakening. Similarly, when the price makes a new high but the momentum does not make a new high, this is often a “bearish” divergence – indicating that the force of the uptrend could be weakening. Typically, trend reversals are often preceded by a divergence (although it is possible for price to change trend without a prior divergence). We can use divergence as an advance warning of when price may potentially change direction – whether a change in the trend direction or just a correction (or pullback).
It is possible for a divergence to be “negated” – which happens when price continues to move in its direction (i.e. in the direction of the major trend) despite a divergence. So often price can negate a divergence (e.g. a bullish or bearish divergence). This can happen quite a lot in strong trends with momentum.
Due to the numerous divergences that can occur on charts (often with many false signals or whipsaws) – it can be better to use divergence in combination with other technical analysis methods to increase the probabilities. For example, combining divergence with other trend reversal chart techniques such as: trendline breaks, moving average crossovers, break of support or resistance, or oscillators like MACD or RSI etc.
The red divergence colour can indicate a potential bullish divergence, blue divergence colour can indicate a potential bearish divergence. The indicator can also warn of potential divergences developing – so a magenta warning can indicate a potential bullish divergence and a yellow/orange warning of a potential bearish divergence.
The pro divergence indicator incorporates green and blue dots to show when RSI and stochastics is oversold or overbought. The RSI overbought/oversold is shown as dark blue dots – and the stochastics overbought/oversold is shown as green dots. This is added as an extra feature to add further information to the divergence signal. The momentum used in the indicator is the MACD.
The indicator can be used on the charts of the majority of markets (e.g. stocks, indices, ETFs, currencies, cryptocurrencies, precious metals, commodities etc.) and any timeframe. It should be noted that the degree of noise and randomness increases significantly on lower timeframes. So the lower the timeframe that is chosen (e.g. 15-min or lower) the greater the degree of noise and randomness and therefore the higher the frequency of false signals or whipsaws.
Chartists should be aware of the probabilistic and uncertain nature of price action and the markets, and therefore prepare to limit and control any potential risks.
If you would like access, please send me a PM on Tradingview.
僅限邀請腳本
僅作者批准的使用者才能訪問此腳本。您需要申請並獲得使用許可,通常需在付款後才能取得。更多詳情,請依照作者以下的指示操作,或直接聯絡LeadingTrader。
TradingView不建議在未完全信任作者並了解其運作方式的情況下購買或使用腳本。您也可以在我們的社群腳本中找到免費的開源替代方案。
作者的說明
Follow this link to obtain access: leadingtrader.com
You may also email: support@leadingtrader.com
You may also email: support@leadingtrader.com
免責聲明
這些資訊和出版物並非旨在提供,也不構成TradingView提供或認可的任何形式的財務、投資、交易或其他類型的建議或推薦。請閱讀使用條款以了解更多資訊。