OPEN-SOURCE SCRIPT
4 Bar Fractal
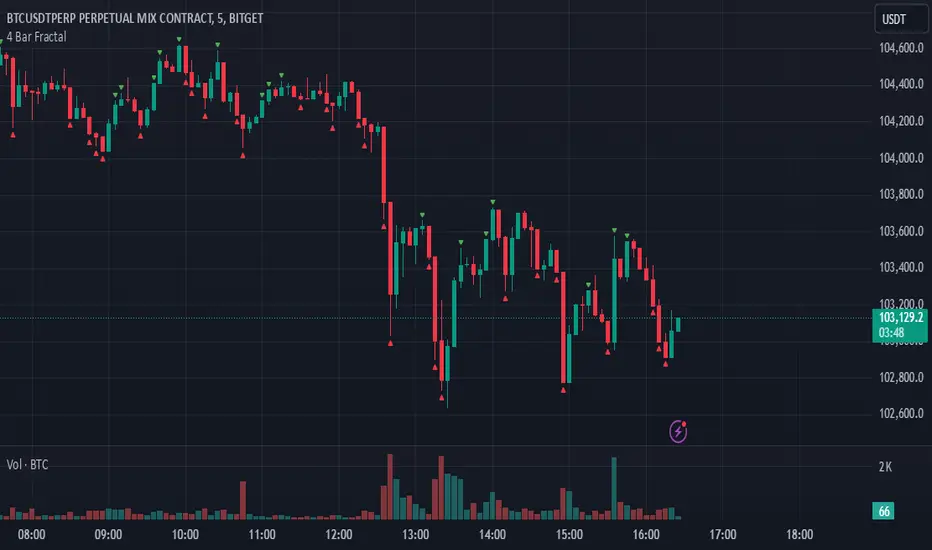
This indicator is a simple yet powerful tool that tracks potential trend reversals by checking whether the closing price of the last candle in a four-candle sequence finishes above or below the highs or lows of both the immediately preceding candle and the first candle in that sequence. If the closing price breaks above those prior highs, a green triangle appears above the chart to indicate bullish momentum; if it breaks below those lows, a red triangle appears below the chart to signal bearish momentum. Not only is it beneficial for scalping or other short-term trading, but it also works well for swing trades and longer-term trends, making it one of the most effective indicators for catching significant market shifts. However, to avoid false breakouts, it is advisable to confirm signals with volume or additional trend indicators and to maintain disciplined risk management.
開源腳本
秉持TradingView一貫精神,這個腳本的創作者將其設為開源,以便交易者檢視並驗證其功能。向作者致敬!您可以免費使用此腳本,但請注意,重新發佈代碼需遵守我們的社群規範。
免責聲明
這些資訊和出版物並非旨在提供,也不構成TradingView提供或認可的任何形式的財務、投資、交易或其他類型的建議或推薦。請閱讀使用條款以了解更多資訊。
免責聲明
這些資訊和出版物並非旨在提供,也不構成TradingView提供或認可的任何形式的財務、投資、交易或其他類型的建議或推薦。請閱讀使用條款以了解更多資訊。