OPEN-SOURCE SCRIPT
25-Day Momentum Index
Description:
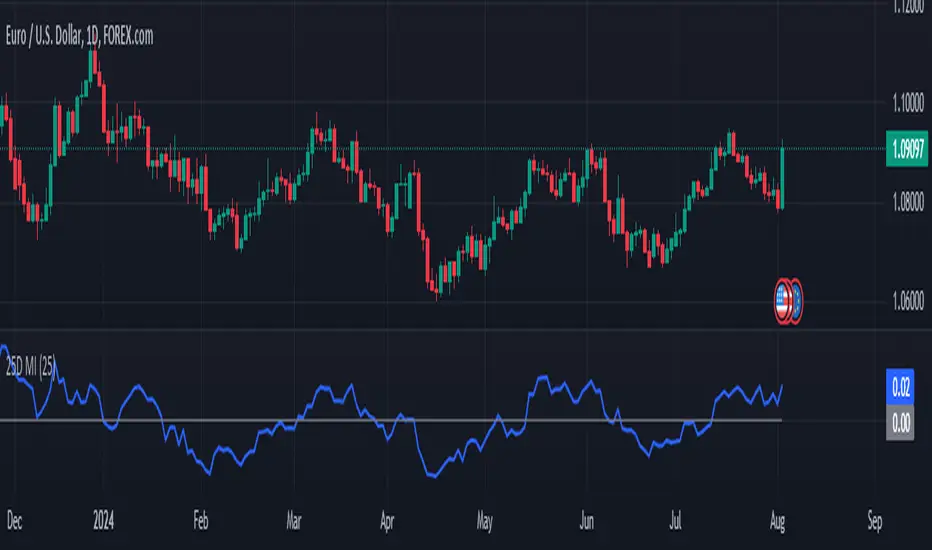
The 25-Day Momentum Index (25D MI) is a technical indicator designed to measure the strength and direction of price movements over a 25-day period. Inspired by classic momentum analysis, this indicator helps traders identify trends and potential reversal points in the market.
How It Works:
Momentum Calculation: The 25D MI calculates momentum as the difference between the current closing price and the closing price 25 days ago. This difference provides insights into the market's recent strength or weakness.
Plotting: The indicator plots the Momentum Index as a blue line, showing the raw momentum values. A zero line is also plotted in gray to serve as a reference point for positive and negative momentum.
Highlighting Zones:
Positive Momentum: When the Momentum Index is above zero, it is plotted in green, highlighting positive momentum phases.
Negative Momentum: When the Momentum Index is below zero, it is plotted in red, highlighting negative momentum phases.
Usage:
A rising curve means an increase in upward momentum - if it is above the zero line. A rising curve below the zero line signifies a decrease in downward momentum. By the same token, a falling curve means an increase in downward momentum below the zero line, a decrease in upward momentum above the zero line.
This indicator is ideal for traders looking to complement their strategy with a visual tool that captures the essence of market momentum over a significant period. Use it to enhance your technical analysis and refine your trading decisions.
開源腳本
秉持TradingView一貫精神,這個腳本的創作者將其設為開源,以便交易者檢視並驗證其功能。向作者致敬!您可以免費使用此腳本,但請注意,重新發佈代碼需遵守我們的社群規範。
免責聲明
這些資訊和出版物並非旨在提供,也不構成TradingView提供或認可的任何形式的財務、投資、交易或其他類型的建議或推薦。請閱讀使用條款以了解更多資訊。
開源腳本
秉持TradingView一貫精神,這個腳本的創作者將其設為開源,以便交易者檢視並驗證其功能。向作者致敬!您可以免費使用此腳本,但請注意,重新發佈代碼需遵守我們的社群規範。
免責聲明
這些資訊和出版物並非旨在提供,也不構成TradingView提供或認可的任何形式的財務、投資、交易或其他類型的建議或推薦。請閱讀使用條款以了解更多資訊。