OPEN-SOURCE SCRIPT
Rob RSI Stoch MACD Combo Alert
//Created by Robert Nance on 5/28/16. Additional credit to vdubus.
//This was a special request from rich15stan. It combines my original RSI Stoch extremes with vdubus’ MACD VXI.
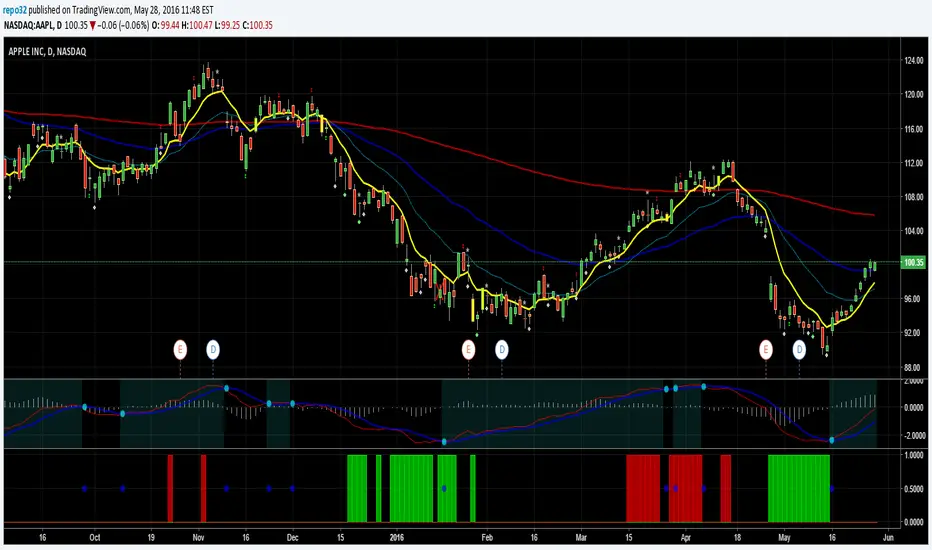
//This script will give you red or green columns as an indication for oversold/overbought,
//based upon the rsi and stochastic both being at certain levels. The default oversold is at 35.
//If Stochastic and RSI fall below 35, you will get a green column. Play with your levels to see how
//your stock reacts. It now adds the MACD crossover, plotted as a blue circle.
//This was a special request from rich15stan. It combines my original RSI Stoch extremes with vdubus’ MACD VXI.
//This script will give you red or green columns as an indication for oversold/overbought,
//based upon the rsi and stochastic both being at certain levels. The default oversold is at 35.
//If Stochastic and RSI fall below 35, you will get a green column. Play with your levels to see how
//your stock reacts. It now adds the MACD crossover, plotted as a blue circle.
開源腳本
秉持TradingView一貫精神,這個腳本的創作者將其設為開源,以便交易者檢視並驗證其功能。向作者致敬!您可以免費使用此腳本,但請注意,重新發佈代碼需遵守我們的社群規範。
免責聲明
這些資訊和出版物並非旨在提供,也不構成TradingView提供或認可的任何形式的財務、投資、交易或其他類型的建議或推薦。請閱讀使用條款以了解更多資訊。
免責聲明
這些資訊和出版物並非旨在提供,也不構成TradingView提供或認可的任何形式的財務、投資、交易或其他類型的建議或推薦。請閱讀使用條款以了解更多資訊。