OPEN-SOURCE SCRIPT
Price above/below EMA
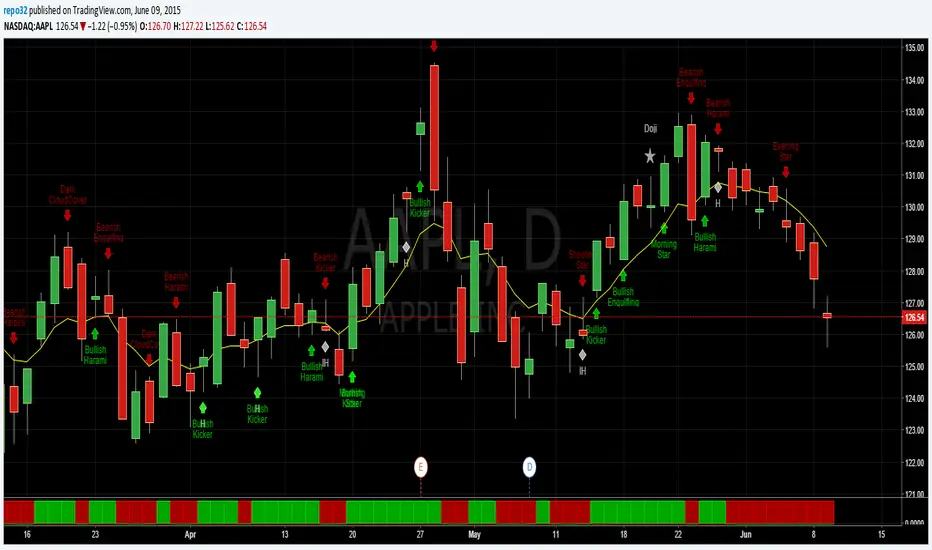
This script will give you red/green columns to indicate if price is above or below a certain EMA. With Candlestick charting, we are looking for price in relation to the 8 ema Trigger Line (T-Line). You can adjust this indicator to fit your need. Simple, but nice to quickly see.
Oops. Last line's title should be "Sell". Doesn't affect display though.
Oops. Last line's title should be "Sell". Doesn't affect display though.
開源腳本
本著TradingView的真正精神,此腳本的創建者將其開源,以便交易者可以查看和驗證其功能。向作者致敬!雖然您可以免費使用它,但請記住,重新發佈程式碼必須遵守我們的網站規則。
相關出版品
免責聲明
這些資訊和出版物並不意味著也不構成TradingView提供或認可的金融、投資、交易或其他類型的意見或建議。請在使用條款閱讀更多資訊。
開源腳本
本著TradingView的真正精神,此腳本的創建者將其開源,以便交易者可以查看和驗證其功能。向作者致敬!雖然您可以免費使用它,但請記住,重新發佈程式碼必須遵守我們的網站規則。
相關出版品
免責聲明
這些資訊和出版物並不意味著也不構成TradingView提供或認可的金融、投資、交易或其他類型的意見或建議。請在使用條款閱讀更多資訊。