INVITE-ONLY SCRIPT
MARITradesGold Indicator A - BUY AND SELL Model
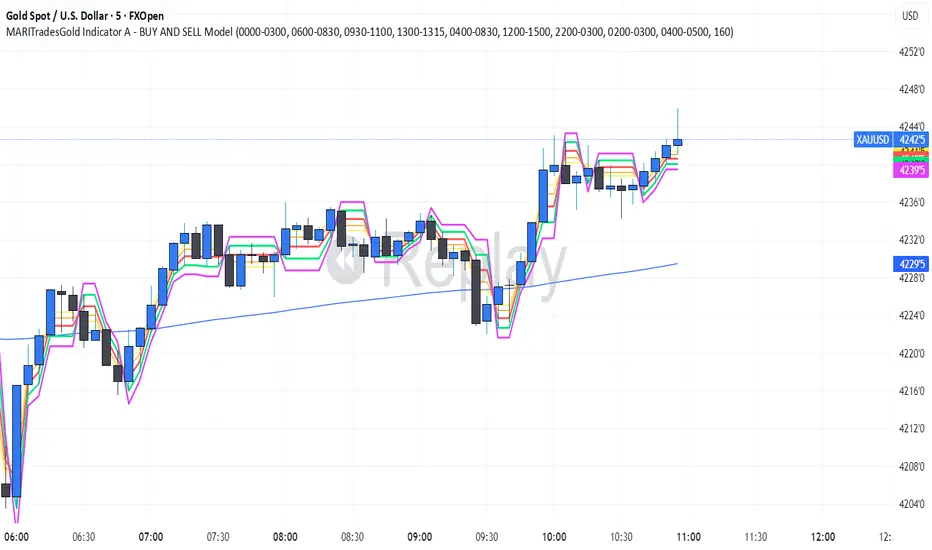
The MARITrades Gold Indicator A – BOS Model is a professional charting tool designed to help traders visually identify structure breaks (BOS) and potential Fibonacci retracement zones during key market sessions on XAU/USD.
It combines session timing filters, Break of Structure logic, and a WMA160 trend bias to help users study clean continuation or reversal setups with precision.
This indicator is intended for traders who are learning or refining their market structure and session-based gold strategy.

KEY FEATURES AND HOW TO USE
Apply the indicator to XAU/USD on a preferred timeframe
Wait for a Break of Structure (BOS) during valid session hours.
Watch for retracement into 0.5–0.618 Fib levels for possible continuation zones which are marked out with coloured lines. you can edit the colours to your preference

Confirm direction with Moving average160 trend bias.
Use Stop loss and take profit levels for educational visualization — not for direct trade execution.
you can keep the indicator free or lines which optional to view the BUY and SELL signals

📊 BOS Detection: Marks bullish or bearish structure breaks after key levels.
📈 Fibonacci Zones: Auto-calculates retracement zones and gives you signal bias
🕒 Session Filters: Includes Sydney, Asian, London, and New York session timing tools.
🧭 Trend Filter: Moving Average (MA160) helps define directional bias.
🧩 Clean Visualization: retracement zones, and structure markers for chart clarity.
🚨 Optional Alerts: Alerts can be added when structure breaks align with session filters.
It combines session timing filters, Break of Structure logic, and a WMA160 trend bias to help users study clean continuation or reversal setups with precision.
This indicator is intended for traders who are learning or refining their market structure and session-based gold strategy.
KEY FEATURES AND HOW TO USE
Apply the indicator to XAU/USD on a preferred timeframe
Wait for a Break of Structure (BOS) during valid session hours.
Watch for retracement into 0.5–0.618 Fib levels for possible continuation zones which are marked out with coloured lines. you can edit the colours to your preference
Confirm direction with Moving average160 trend bias.
Use Stop loss and take profit levels for educational visualization — not for direct trade execution.
you can keep the indicator free or lines which optional to view the BUY and SELL signals
📊 BOS Detection: Marks bullish or bearish structure breaks after key levels.
📈 Fibonacci Zones: Auto-calculates retracement zones and gives you signal bias
🕒 Session Filters: Includes Sydney, Asian, London, and New York session timing tools.
🧭 Trend Filter: Moving Average (MA160) helps define directional bias.
🧩 Clean Visualization: retracement zones, and structure markers for chart clarity.
🚨 Optional Alerts: Alerts can be added when structure breaks align with session filters.
僅限邀請腳本
僅作者批准的使用者才能訪問此腳本。您需要申請並獲得使用許可,通常需在付款後才能取得。更多詳情,請依照作者以下的指示操作,或直接聯絡MARITradesGold。
TradingView不建議在未完全信任作者並了解其運作方式的情況下購買或使用腳本。您也可以在我們的社群腳本中找到免費的開源替代方案。
作者的說明
Use this indicator for learning and chart study only.
It does not guarantee any result or predict market outcomes.
Always backtest and confirm your analysis before trading live.
Compatible with standard candlestick charts
免責聲明
這些資訊和出版物並非旨在提供,也不構成TradingView提供或認可的任何形式的財務、投資、交易或其他類型的建議或推薦。請閱讀使用條款以了解更多資訊。