INVITE-ONLY SCRIPT
AlphaZ-Score - Bitcoin Market Cycle Indicator
WHAT IS ALPHAZ-SCORE?
AlphaZ-Score is a Bitcoin-specific market cycle indicator that identifies extreme market conditions (tops and bottoms) by aggregating up to 7 independent on-chain and market metrics into a single normalized z-score. Unlike traditional oscillators that analyze only price action, AlphaZ-Score incorporates blockchain fundamentals, investor profitability metrics, and capital flow data to determine where Bitcoin sits within its long-term market cycle.
The output ranges from -3 (extreme oversold/cycle bottom) to +3 (extreme overbought/cycle top), with readings beyond ±2 indicating high-probability reversal zones.
METHODOLOGY - THE 7-COMPONENT SYSTEM
Each component analyzes Bitcoin's market state from a unique perspective, then gets z-scored (statistical normalization) so all metrics can be compared on equal footing. The final score is a weighted average of all enabled indicators.
Default Configuration (3 indicators enabled):
Stablecoin Supply Ratio (SSRO)
MVRV Z-Score
SOPR Z-Score
Optional Advanced Components (4 indicators disabled by default):
Days Higher Streak Valuation (DHSV)
High Probability OB/OS (HPOB)
Risk Index Z-Score
Comprehensive On-chain Z-Score
COMPONENT BREAKDOWN
1. STABLECOIN SUPPLY RATIO OSCILLATOR (SSRO) - ENABLED BY DEFAULT
What it measures: Ratio of Bitcoin market cap to total stablecoin supply (USDT + USDC)
Data sources:
CRYPTOCAP:BTC - Bitcoin market cap
CRYPTOCAP:USDT - Tether market cap
CRYPTOCAP:USDC - USD Coin market cap
Logic:
SSR = BTC Market Cap / (USDT + USDC Supply)
Z-Score = Standardized SSR over 200 periods
Interpretation:
High SSR (positive z-score): Bitcoin overvalued relative to available stablecoin buying power → Overbought
Low SSR (negative z-score): Massive stablecoin reserves relative to BTC value → Potential bottom (dry powder)
Why it works: Stablecoins represent "dry powder" - capital waiting to enter crypto. When stablecoin supply is high relative to BTC value, it signals accumulation potential. When low, it suggests exhausted buying power.
2. MVRV Z-SCORE - ENABLED BY DEFAULT
What it measures: Market Value to Realized Value ratio, z-scored over 520 periods
Data source: INTOTHEBLOCK:BTC_MVRV
Logic:
MVRV = Market Cap / Realized Cap
Z-Score = (MVRV - Mean) / Std Dev
Interpretation:
High MVRV (positive z-score): Average holder in significant profit → Distribution phase
Low MVRV (negative z-score): Average holder near breakeven/loss → Accumulation phase
Why it works: MVRV compares Bitcoin's market price to its "fair value" (realized price = average cost basis of all coins). Extreme deviations historically mark cycle tops (MVRV > 3.5) and bottoms (MVRV < 1.0).
Historical significance:
2017 top: MVRV z-score ~7
2018 bottom: MVRV z-score ~-1.5
2021 top: MVRV z-score ~6
2022 bottom: MVRV z-score ~-1.0
3. SOPR Z-SCORE - ENABLED BY DEFAULT
What it measures: Spent Output Profit Ratio, smoothed and z-scored
Data source: GLASSNODE:BTC_SOPR
Logic:
SOPR = Value of spent outputs / Value at creation
SOPR EMA = 7-period exponential moving average
Z-Score = Standardized SOPR EMA over 180 periods
Interpretation:
SOPR > 1 (positive z-score): Coins being spent at profit → Potential distribution
SOPR < 1 (negative z-score): Coins being spent at loss → Capitulation/bottom
Why it works: SOPR measures aggregate profitability of spent coins. When holders are forced to sell at losses (SOPR < 1), it indicates capitulation and potential bottoms. When everyone sells at profit (SOPR >> 1), it signals euphoria and potential tops.
4. DAYS HIGHER STREAK VALUATION (DHSV) - DISABLED BY DEFAULT
What it measures: Number of historical bars with prices higher than current level
Logic:
For last N bars, count how many had close > current close
Apply streak decay logic based on price threshold
Z-Score result over lookback period
Interpretation:
Few days higher (negative z-score): Price near all-time highs → Potential overbought
Many days higher (positive z-score): Price deep below historical levels → Oversold
Why it works: Measures how "expensive" current price is relative to history. When 90%+ of historical bars are higher, you're near cycle bottoms.
Settings:
Historical Bars (1000): How far back to look
Threshold & Decay: Sensitivity adjustments
5. HIGH PROBABILITY OVERBOUGHT/OVERSOLD (HPOB) - DISABLED BY DEFAULT
What it measures: Volume-weighted price momentum divergence
Logic:
Volume-weighted Hull MA vs Standard Hull MA
Difference normalized by 100-period SMA
Result inverted and scaled to match z-score range
Interpretation:
Positive score: Volume-weighted momentum diverging up → Overbought
Negative score: Volume-weighted momentum diverging down → Oversold
Why it works: When volume-weighted price movement diverges from standard price movement, it reveals institutional vs retail behavior mismatches.
Settings:
SVWHMA Length (50): Volume-weighted smoothing
HMA Length (50): Standard momentum baseline
Smooth Length (50): Final output smoothing
6. RISK INDEX Z-SCORE - DISABLED BY DEFAULT
What it measures: Modified Puell Multiple approach using realized cap
Data sources:
COINMETRICS:BTC_MARKETCAPREAL - Realized market cap
GLASSNODE:BTC_MARKETCAP - Current market cap
Logic:
Delta = Risk Multiplier × Realized Cap - Historical Realized Cap
Risk Index = (Delta / Market Cap × 100) / 24
Z-Score = Standardized Risk Index over 1500 periods
Interpretation:
High risk (positive z-score): Realized cap growth outpacing market cap → Overextended
Low risk (negative z-score): Market cap collapsed relative to realized cap → Undervalued
Why it works: Compares the rate of realized cap change to market cap. Rapid realized cap growth during low market cap periods signals accumulation.
7. COMPREHENSIVE ON-CHAIN Z-SCORE - DISABLED BY DEFAULT
What it measures: Average of three on-chain metrics: NUPL, SOPR, and MVRV
Data sources:
GLASSNODE:BTC_MARKETCAP - Current market cap
COINMETRICS:BTC_MARKETCAPREAL - Realized cap
GLASSNODE:BTC_SOPR - SOPR data
Logic:
NUPL = (Market Cap - Realized Cap) / Market Cap × 100
SOPR Z-Score = (SOPR - Mean) / Std Dev with EMA smoothing
MVRV = Market Cap / Realized Cap
Final Score = Average of all three z-scores
Interpretation:
Combines profitability (NUPL), spending behavior (SOPR), and valuation (MVRV) into single comprehensive on-chain metric.
AGGREGATION METHODOLOGY
Scoring System:
Each enabled indicator produces a z-score (typically -3 to +3 range)
Scores are weighted equally (weight = 1.0 for all)
Final output = Weighted average of all enabled indicators
Why Equal Weighting:
Each metric analyzes fundamentally different aspects of Bitcoin's market state. Equal weighting prevents any single data source from dominating and ensures diversification.
Customization:
Users can enable/disable indicators to:
Simplify analysis (3 core metrics)
Increase complexity (all 7 metrics)
Focus on specific aspects (only on-chain, only market-based, etc.)
INTERPRETATION GUIDE
Z-Score Ranges:
+3.0 and above - EXTREME OVERBOUGHT
Historical cycle tops
Maximum euphoria
High-probability distribution zone
Consider taking profits
+2.0 to +3.0 - OVERBOUGHT
Late bull market phase
Elevated risk
Cautious positioning recommended
-2.0 to +2.0 - NEUTRAL
Normal market conditions
Trend-following strategies appropriate
-2.0 to -3.0 - OVERSOLD
Early accumulation phase
Fear/capitulation stage
Begin DCA strategies
-3.0 and below - EXTREME OVERSOLD
Historical cycle bottoms
Maximum fear
High-probability accumulation zone
Prime buying opportunity
VISUAL COMPONENTS
1. Main Z-Score Line:
Dynamic color gradient based on value
Green shades: Oversold (buying opportunity)
Red shades: Overbought (distribution zone)
White: Neutral
2. Reference Lines:
0: Neutral baseline
±2: Overbought/Oversold thresholds
±3: Extreme zones (highest probability reversals)
3. Background Shading:
Light green: Oversold (-2 to -3)
Bright green: Extreme oversold (< -3)
Light red: Overbought (+2 to +3)
Bright red: Extreme overbought (> +3)
4. Bar Coloring:
Cyan bars: Oversold conditions
Red bars: Overbought conditions
Default: Neutral
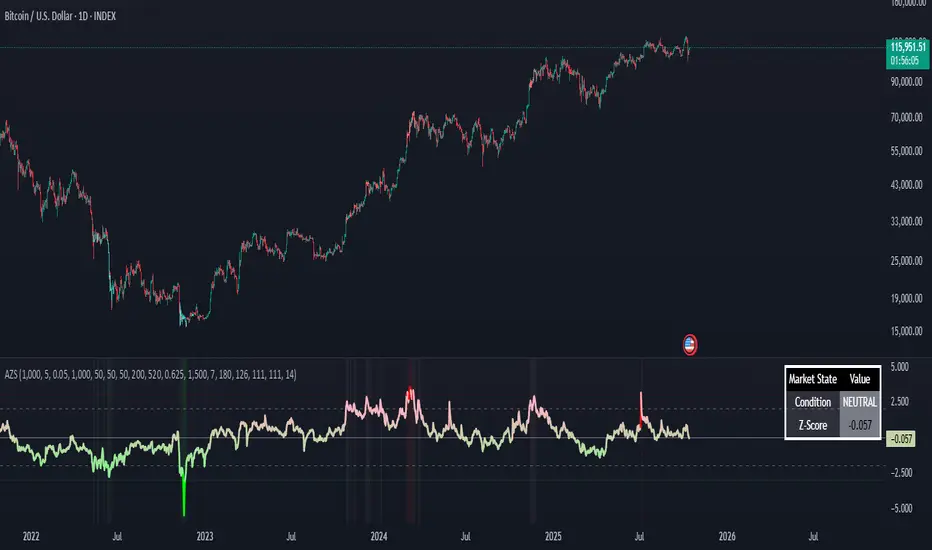
5. Summary Table (Top Right):
Market State: Current condition (Extreme OB/OS, Overbought/Oversold, Neutral)
Z-Score Value: Precise numeric reading
HOW TO USE
For Long-Term Investors (DCA Strategy):
Aggressive accumulation: Z-score < -2 (especially < -3)
Regular accumulation: Z-score between -2 and 0
Hold: Z-score between 0 and +2
Take profits: Z-score > +2 (especially > +3)
For Cycle Traders:
Buy zone: Wait for z-score to drop below -2
Hold through: Ignore noise between -2 and +2
Sell zone: Start distributing when z-score exceeds +2
Exit: Complete exit if z-score reaches +3
Risk Management:
Never buy in extreme overbought (>+3) - Historically always preceded major crashes
Scale into positions - Don't go all-in at any single reading
Use with price action - Confirm with support/resistance levels
Best Timeframes:
1D (Daily): Primary timeframe for cycle analysis
1W (Weekly): Macro cycle perspective
Lower timeframes not recommended (designed for long-term cycles)
SETTINGS CONFIGURATION
General Settings:
Toggle each of 7 indicators on/off
Default: 3 indicators enabled (SSRO, MVRV, SOPR)
Advanced: Enable all 7 for maximum sensitivity
Individual Indicator Settings:
Each indicator has dedicated parameter groups:
DHSV: Historical lookback, threshold decay
HPOB: HMA and VWMA lengths, smoothing
SSRO: Z-score calculation period (200)
MVRV: Z-score length (520)
Risk: Multiplier and z-score length
SOPR: EMA smoothing (7), z-score period (180)
On-chain: Separate lengths for NUPL, SOPR, MVRV components
DATA REQUIREMENTS
Required External Data Sources:
Default configuration (3 indicators):
CRYPTOCAP:BTC - Bitcoin market cap
CRYPTOCAP:USDT - Tether supply
CRYPTOCAP:USDC - USD Coin supply
INTOTHEBLOCK:BTC_MVRV - MVRV ratio
GLASSNODE:BTC_SOPR - SOPR data
Optional indicators require:
GLASSNODE:BTC_MARKETCAP - Market cap (on-chain)
COINMETRICS:BTC_MARKETCAPREAL - Realized cap
Additional Glassnode metrics
Important: This indicator requires TradingView data subscriptions for on-chain metrics. Some data sources may not be available on all accounts.
HISTORICAL PERFORMANCE
Major Cycle Tops Identified:
November 2021: Z-score peaked at ~+2.8 before -50% crash
December 2017: Z-score exceeded +3.0 before -84% bear market
April 2013: Z-score hit extreme overbought before correction
Major Cycle Bottoms Identified:
November 2022: Z-score reached -2.5 before +100% rally
December 2018: Z-score dropped to -2.8 before +300% bull run
January 2015: Z-score hit -3.2 before multi-year bull market
Key Insight: Extreme readings (beyond ±2.5) have preceded major market reversals with high accuracy. The indicator is designed for cycle identification, not short-term trading.
ORIGINALITY - WHY THIS IS UNIQUE
Traditional Cycle Indicators:
Use single metrics (MVRV only, SOPR only, etc.)
No normalization - hard to compare metrics
Fixed thresholds that don't adapt to market evolution
Often proprietary black boxes
AlphaZ-Score Advantages:
Multi-Metric Aggregation: Combines on-chain fundamentals, market structure, and capital flows into single score
Statistical Normalization: Z-scoring allows fair comparison of completely different metrics (market cap ratios vs profitability metrics)
Modular Design: Enable only the metrics you trust or have data access to
Transparent Calculations: All formulas visible in open-source code
Bitcoin-Specific Optimization: Tuned specifically for Bitcoin's 4-year halving cycle and on-chain characteristics
Customizable Weighting: Advanced users can modify weights for different market regimes
Visual Clarity: Single line that clearly shows cycle position, unlike juggling multiple indicators
LIMITATIONS
Requires on-chain data subscriptions - Some metrics need premium TradingView data
Lagging indicator - Identifies cycles after they begin, not predictive
Bitcoin-specific - Not designed for altcoins or traditional markets
Long-term focus - Not suitable for day trading or short-term speculation
Data availability - Historical on-chain data only goes back to ~2010
External dependencies - Relies on Glassnode, CoinMetrics data accuracy
ALERTS
No built-in alerts (indicator designed for visual analysis of long-term cycles). Users can create custom alerts based on z-score thresholds.
BEST PRACTICES
✅ Use on daily or weekly timeframe only
✅ Combine with long-term moving averages (200 MA, 200 WMA)
✅ Wait for extreme readings (beyond ±2) before major decisions
✅ Scale positions - don't go all-in at any single reading
✅ Verify on-chain data sources are updating properly
❌ Don't use for short-term trading (minutes/hours)
❌ Don't ignore price action - confirm with chart patterns
❌ Don't expect perfect timing - cycles can extend beyond extremes
❌ Don't trade solely on this indicator - use as confluence
Not financial advice. This indicator identifies market cycles based on historical patterns and on-chain data. Past performance does not guarantee future results. Always use proper risk management and position sizing.
AlphaZ-Score is a Bitcoin-specific market cycle indicator that identifies extreme market conditions (tops and bottoms) by aggregating up to 7 independent on-chain and market metrics into a single normalized z-score. Unlike traditional oscillators that analyze only price action, AlphaZ-Score incorporates blockchain fundamentals, investor profitability metrics, and capital flow data to determine where Bitcoin sits within its long-term market cycle.
The output ranges from -3 (extreme oversold/cycle bottom) to +3 (extreme overbought/cycle top), with readings beyond ±2 indicating high-probability reversal zones.
METHODOLOGY - THE 7-COMPONENT SYSTEM
Each component analyzes Bitcoin's market state from a unique perspective, then gets z-scored (statistical normalization) so all metrics can be compared on equal footing. The final score is a weighted average of all enabled indicators.
Default Configuration (3 indicators enabled):
Stablecoin Supply Ratio (SSRO)
MVRV Z-Score
SOPR Z-Score
Optional Advanced Components (4 indicators disabled by default):
Days Higher Streak Valuation (DHSV)
High Probability OB/OS (HPOB)
Risk Index Z-Score
Comprehensive On-chain Z-Score
COMPONENT BREAKDOWN
1. STABLECOIN SUPPLY RATIO OSCILLATOR (SSRO) - ENABLED BY DEFAULT
What it measures: Ratio of Bitcoin market cap to total stablecoin supply (USDT + USDC)
Data sources:
CRYPTOCAP:BTC - Bitcoin market cap
CRYPTOCAP:USDT - Tether market cap
CRYPTOCAP:USDC - USD Coin market cap
Logic:
SSR = BTC Market Cap / (USDT + USDC Supply)
Z-Score = Standardized SSR over 200 periods
Interpretation:
High SSR (positive z-score): Bitcoin overvalued relative to available stablecoin buying power → Overbought
Low SSR (negative z-score): Massive stablecoin reserves relative to BTC value → Potential bottom (dry powder)
Why it works: Stablecoins represent "dry powder" - capital waiting to enter crypto. When stablecoin supply is high relative to BTC value, it signals accumulation potential. When low, it suggests exhausted buying power.
2. MVRV Z-SCORE - ENABLED BY DEFAULT
What it measures: Market Value to Realized Value ratio, z-scored over 520 periods
Data source: INTOTHEBLOCK:BTC_MVRV
Logic:
MVRV = Market Cap / Realized Cap
Z-Score = (MVRV - Mean) / Std Dev
Interpretation:
High MVRV (positive z-score): Average holder in significant profit → Distribution phase
Low MVRV (negative z-score): Average holder near breakeven/loss → Accumulation phase
Why it works: MVRV compares Bitcoin's market price to its "fair value" (realized price = average cost basis of all coins). Extreme deviations historically mark cycle tops (MVRV > 3.5) and bottoms (MVRV < 1.0).
Historical significance:
2017 top: MVRV z-score ~7
2018 bottom: MVRV z-score ~-1.5
2021 top: MVRV z-score ~6
2022 bottom: MVRV z-score ~-1.0
3. SOPR Z-SCORE - ENABLED BY DEFAULT
What it measures: Spent Output Profit Ratio, smoothed and z-scored
Data source: GLASSNODE:BTC_SOPR
Logic:
SOPR = Value of spent outputs / Value at creation
SOPR EMA = 7-period exponential moving average
Z-Score = Standardized SOPR EMA over 180 periods
Interpretation:
SOPR > 1 (positive z-score): Coins being spent at profit → Potential distribution
SOPR < 1 (negative z-score): Coins being spent at loss → Capitulation/bottom
Why it works: SOPR measures aggregate profitability of spent coins. When holders are forced to sell at losses (SOPR < 1), it indicates capitulation and potential bottoms. When everyone sells at profit (SOPR >> 1), it signals euphoria and potential tops.
4. DAYS HIGHER STREAK VALUATION (DHSV) - DISABLED BY DEFAULT
What it measures: Number of historical bars with prices higher than current level
Logic:
For last N bars, count how many had close > current close
Apply streak decay logic based on price threshold
Z-Score result over lookback period
Interpretation:
Few days higher (negative z-score): Price near all-time highs → Potential overbought
Many days higher (positive z-score): Price deep below historical levels → Oversold
Why it works: Measures how "expensive" current price is relative to history. When 90%+ of historical bars are higher, you're near cycle bottoms.
Settings:
Historical Bars (1000): How far back to look
Threshold & Decay: Sensitivity adjustments
5. HIGH PROBABILITY OVERBOUGHT/OVERSOLD (HPOB) - DISABLED BY DEFAULT
What it measures: Volume-weighted price momentum divergence
Logic:
Volume-weighted Hull MA vs Standard Hull MA
Difference normalized by 100-period SMA
Result inverted and scaled to match z-score range
Interpretation:
Positive score: Volume-weighted momentum diverging up → Overbought
Negative score: Volume-weighted momentum diverging down → Oversold
Why it works: When volume-weighted price movement diverges from standard price movement, it reveals institutional vs retail behavior mismatches.
Settings:
SVWHMA Length (50): Volume-weighted smoothing
HMA Length (50): Standard momentum baseline
Smooth Length (50): Final output smoothing
6. RISK INDEX Z-SCORE - DISABLED BY DEFAULT
What it measures: Modified Puell Multiple approach using realized cap
Data sources:
COINMETRICS:BTC_MARKETCAPREAL - Realized market cap
GLASSNODE:BTC_MARKETCAP - Current market cap
Logic:
Delta = Risk Multiplier × Realized Cap - Historical Realized Cap
Risk Index = (Delta / Market Cap × 100) / 24
Z-Score = Standardized Risk Index over 1500 periods
Interpretation:
High risk (positive z-score): Realized cap growth outpacing market cap → Overextended
Low risk (negative z-score): Market cap collapsed relative to realized cap → Undervalued
Why it works: Compares the rate of realized cap change to market cap. Rapid realized cap growth during low market cap periods signals accumulation.
7. COMPREHENSIVE ON-CHAIN Z-SCORE - DISABLED BY DEFAULT
What it measures: Average of three on-chain metrics: NUPL, SOPR, and MVRV
Data sources:
GLASSNODE:BTC_MARKETCAP - Current market cap
COINMETRICS:BTC_MARKETCAPREAL - Realized cap
GLASSNODE:BTC_SOPR - SOPR data
Logic:
NUPL = (Market Cap - Realized Cap) / Market Cap × 100
SOPR Z-Score = (SOPR - Mean) / Std Dev with EMA smoothing
MVRV = Market Cap / Realized Cap
Final Score = Average of all three z-scores
Interpretation:
Combines profitability (NUPL), spending behavior (SOPR), and valuation (MVRV) into single comprehensive on-chain metric.
AGGREGATION METHODOLOGY
Scoring System:
Each enabled indicator produces a z-score (typically -3 to +3 range)
Scores are weighted equally (weight = 1.0 for all)
Final output = Weighted average of all enabled indicators
Why Equal Weighting:
Each metric analyzes fundamentally different aspects of Bitcoin's market state. Equal weighting prevents any single data source from dominating and ensures diversification.
Customization:
Users can enable/disable indicators to:
Simplify analysis (3 core metrics)
Increase complexity (all 7 metrics)
Focus on specific aspects (only on-chain, only market-based, etc.)
INTERPRETATION GUIDE
Z-Score Ranges:
+3.0 and above - EXTREME OVERBOUGHT
Historical cycle tops
Maximum euphoria
High-probability distribution zone
Consider taking profits
+2.0 to +3.0 - OVERBOUGHT
Late bull market phase
Elevated risk
Cautious positioning recommended
-2.0 to +2.0 - NEUTRAL
Normal market conditions
Trend-following strategies appropriate
-2.0 to -3.0 - OVERSOLD
Early accumulation phase
Fear/capitulation stage
Begin DCA strategies
-3.0 and below - EXTREME OVERSOLD
Historical cycle bottoms
Maximum fear
High-probability accumulation zone
Prime buying opportunity
VISUAL COMPONENTS
1. Main Z-Score Line:
Dynamic color gradient based on value
Green shades: Oversold (buying opportunity)
Red shades: Overbought (distribution zone)
White: Neutral
2. Reference Lines:
0: Neutral baseline
±2: Overbought/Oversold thresholds
±3: Extreme zones (highest probability reversals)
3. Background Shading:
Light green: Oversold (-2 to -3)
Bright green: Extreme oversold (< -3)
Light red: Overbought (+2 to +3)
Bright red: Extreme overbought (> +3)
4. Bar Coloring:
Cyan bars: Oversold conditions
Red bars: Overbought conditions
Default: Neutral
5. Summary Table (Top Right):
Market State: Current condition (Extreme OB/OS, Overbought/Oversold, Neutral)
Z-Score Value: Precise numeric reading
HOW TO USE
For Long-Term Investors (DCA Strategy):
Aggressive accumulation: Z-score < -2 (especially < -3)
Regular accumulation: Z-score between -2 and 0
Hold: Z-score between 0 and +2
Take profits: Z-score > +2 (especially > +3)
For Cycle Traders:
Buy zone: Wait for z-score to drop below -2
Hold through: Ignore noise between -2 and +2
Sell zone: Start distributing when z-score exceeds +2
Exit: Complete exit if z-score reaches +3
Risk Management:
Never buy in extreme overbought (>+3) - Historically always preceded major crashes
Scale into positions - Don't go all-in at any single reading
Use with price action - Confirm with support/resistance levels
Best Timeframes:
1D (Daily): Primary timeframe for cycle analysis
1W (Weekly): Macro cycle perspective
Lower timeframes not recommended (designed for long-term cycles)
SETTINGS CONFIGURATION
General Settings:
Toggle each of 7 indicators on/off
Default: 3 indicators enabled (SSRO, MVRV, SOPR)
Advanced: Enable all 7 for maximum sensitivity
Individual Indicator Settings:
Each indicator has dedicated parameter groups:
DHSV: Historical lookback, threshold decay
HPOB: HMA and VWMA lengths, smoothing
SSRO: Z-score calculation period (200)
MVRV: Z-score length (520)
Risk: Multiplier and z-score length
SOPR: EMA smoothing (7), z-score period (180)
On-chain: Separate lengths for NUPL, SOPR, MVRV components
DATA REQUIREMENTS
Required External Data Sources:
Default configuration (3 indicators):
CRYPTOCAP:BTC - Bitcoin market cap
CRYPTOCAP:USDT - Tether supply
CRYPTOCAP:USDC - USD Coin supply
INTOTHEBLOCK:BTC_MVRV - MVRV ratio
GLASSNODE:BTC_SOPR - SOPR data
Optional indicators require:
GLASSNODE:BTC_MARKETCAP - Market cap (on-chain)
COINMETRICS:BTC_MARKETCAPREAL - Realized cap
Additional Glassnode metrics
Important: This indicator requires TradingView data subscriptions for on-chain metrics. Some data sources may not be available on all accounts.
HISTORICAL PERFORMANCE
Major Cycle Tops Identified:
November 2021: Z-score peaked at ~+2.8 before -50% crash
December 2017: Z-score exceeded +3.0 before -84% bear market
April 2013: Z-score hit extreme overbought before correction
Major Cycle Bottoms Identified:
November 2022: Z-score reached -2.5 before +100% rally
December 2018: Z-score dropped to -2.8 before +300% bull run
January 2015: Z-score hit -3.2 before multi-year bull market
Key Insight: Extreme readings (beyond ±2.5) have preceded major market reversals with high accuracy. The indicator is designed for cycle identification, not short-term trading.
ORIGINALITY - WHY THIS IS UNIQUE
Traditional Cycle Indicators:
Use single metrics (MVRV only, SOPR only, etc.)
No normalization - hard to compare metrics
Fixed thresholds that don't adapt to market evolution
Often proprietary black boxes
AlphaZ-Score Advantages:
Multi-Metric Aggregation: Combines on-chain fundamentals, market structure, and capital flows into single score
Statistical Normalization: Z-scoring allows fair comparison of completely different metrics (market cap ratios vs profitability metrics)
Modular Design: Enable only the metrics you trust or have data access to
Transparent Calculations: All formulas visible in open-source code
Bitcoin-Specific Optimization: Tuned specifically for Bitcoin's 4-year halving cycle and on-chain characteristics
Customizable Weighting: Advanced users can modify weights for different market regimes
Visual Clarity: Single line that clearly shows cycle position, unlike juggling multiple indicators
LIMITATIONS
Requires on-chain data subscriptions - Some metrics need premium TradingView data
Lagging indicator - Identifies cycles after they begin, not predictive
Bitcoin-specific - Not designed for altcoins or traditional markets
Long-term focus - Not suitable for day trading or short-term speculation
Data availability - Historical on-chain data only goes back to ~2010
External dependencies - Relies on Glassnode, CoinMetrics data accuracy
ALERTS
No built-in alerts (indicator designed for visual analysis of long-term cycles). Users can create custom alerts based on z-score thresholds.
BEST PRACTICES
✅ Use on daily or weekly timeframe only
✅ Combine with long-term moving averages (200 MA, 200 WMA)
✅ Wait for extreme readings (beyond ±2) before major decisions
✅ Scale positions - don't go all-in at any single reading
✅ Verify on-chain data sources are updating properly
❌ Don't use for short-term trading (minutes/hours)
❌ Don't ignore price action - confirm with chart patterns
❌ Don't expect perfect timing - cycles can extend beyond extremes
❌ Don't trade solely on this indicator - use as confluence
Not financial advice. This indicator identifies market cycles based on historical patterns and on-chain data. Past performance does not guarantee future results. Always use proper risk management and position sizing.
僅限邀請腳本
只有經作者批准的使用者才能訪問此腳本。您需要申請並獲得使用權限。該權限通常在付款後授予。如欲了解更多詳情,請依照以下作者的說明操作,或直接聯絡AlphaEdge_。
除非您完全信任其作者並了解腳本的工作原理,否則TradingView不建議您付費或使用腳本。您也可以在我們的社群腳本中找到免費的開源替代方案。
作者的說明
message me on TV
免責聲明
這些資訊和出版物並不意味著也不構成TradingView提供或認可的金融、投資、交易或其他類型的意見或建議。請在使用條款閱讀更多資訊。
僅限邀請腳本
只有經作者批准的使用者才能訪問此腳本。您需要申請並獲得使用權限。該權限通常在付款後授予。如欲了解更多詳情,請依照以下作者的說明操作,或直接聯絡AlphaEdge_。
除非您完全信任其作者並了解腳本的工作原理,否則TradingView不建議您付費或使用腳本。您也可以在我們的社群腳本中找到免費的開源替代方案。
作者的說明
message me on TV
免責聲明
這些資訊和出版物並不意味著也不構成TradingView提供或認可的金融、投資、交易或其他類型的意見或建議。請在使用條款閱讀更多資訊。