OPEN-SOURCE SCRIPT
已更新 Volume Support & Resistance multi timeframe [LM]
Hello guys,
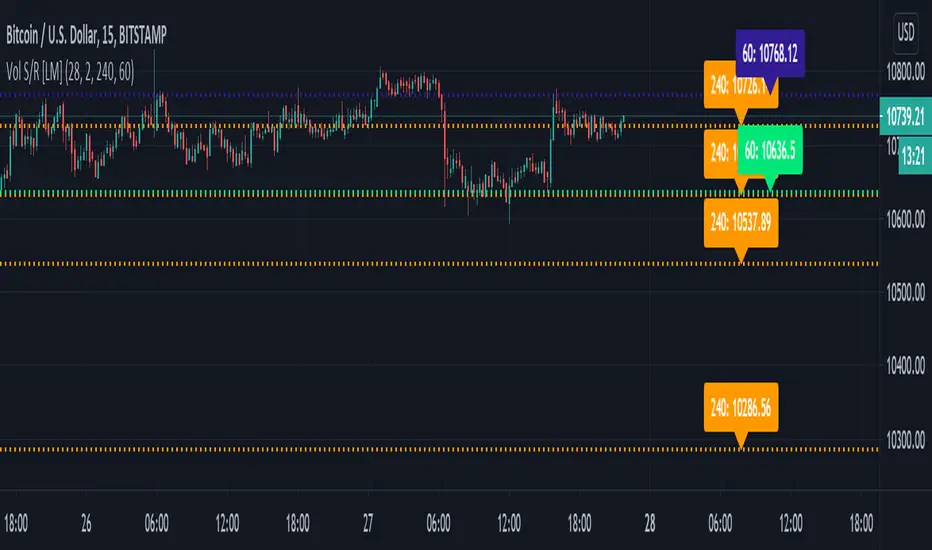
I would like to introduce you volume support and resistance horizontals. It draws line horizontal on high and low high volume candles that has volume above volume MA for certain period multiplied by multiplier and also the volume is increasing from previous volume . You can select lines on this timeframe and/or another one.
The colors are dynamic depending whether price is below or above the line:
for the current timeframe green is used for support and blue for resistance
for the other timeframe by default 4h orange is used for support and violet for resistance
There are various sections in setting:
volume - here you can select SMA volume length and multiplier
show and hide section of the current timeframe
other timeframe
show and hide other timeframe horizontals
I'm mainly looking smaller timeframe and trading higher timeframe from level to level
Any suggestions are welcome
發行說明
fixing multi timeframe behavior發行說明
adding another timeframe and labels for values發行說明
update to version 5開源腳本
秉持TradingView一貫精神,這個腳本的創作者將其設為開源,以便交易者檢視並驗證其功能。向作者致敬!您可以免費使用此腳本,但請注意,重新發佈代碼需遵守我們的社群規範。
免責聲明
這些資訊和出版物並非旨在提供,也不構成TradingView提供或認可的任何形式的財務、投資、交易或其他類型的建議或推薦。請閱讀使用條款以了解更多資訊。
免責聲明
這些資訊和出版物並非旨在提供,也不構成TradingView提供或認可的任何形式的財務、投資、交易或其他類型的建議或推薦。請閱讀使用條款以了解更多資訊。