OPEN-SOURCE SCRIPT
FlowShift Oscillator
FlowShift Oscillator
Overview
The FlowShift Oscillator is a sophisticated momentum indicator designed to capture short-term shifts in market strength, identify trend acceleration, and highlight potential reversals. Combining baseline trend analysis with normalized momentum displacement and volatility-adjusted thresholds, FlowShift provides traders with a responsive, adaptive, and visually intuitive tool suitable for multiple timeframes and asset classes. Whether used for intraday scalping or longer-term trend following, FlowShift helps traders make informed decisions with precision and confidence.

Features
How It Works
FlowShift calculates the displacement of price from a baseline moving average to identify deviations from the prevailing trend. This displacement is normalized and smoothed using exponential moving averages, producing a clean oscillator line that highlights genuine momentum changes. The oscillator’s dynamic thresholds are determined by a percentile of recent absolute values, providing an adaptive reference for extreme conditions in both bullish and bearish markets.
Signals
Visual Interpretation
Usage Notes
Conclusion
FlowShift Oscillator delivers a powerful, adaptive, and visually intuitive approach to momentum analysis. By combining baseline trend assessment, normalized momentum, and dynamic volatility scaling, it enables traders to anticipate market shifts, spot trend accelerations, and make timely trading decisions across a wide range of markets and timeframes.
Overview
The FlowShift Oscillator is a sophisticated momentum indicator designed to capture short-term shifts in market strength, identify trend acceleration, and highlight potential reversals. Combining baseline trend analysis with normalized momentum displacement and volatility-adjusted thresholds, FlowShift provides traders with a responsive, adaptive, and visually intuitive tool suitable for multiple timeframes and asset classes. Whether used for intraday scalping or longer-term trend following, FlowShift helps traders make informed decisions with precision and confidence.
Features
- Customizable Baseline Moving Average: Select from SMA, EMA, SMMA (RMA), WMA, or VWMA to define the underlying trend. Adjustable length allows for tuning to specific market conditions.
- Normalized Momentum Calculation: Measures price displacement relative to the baseline MA, removing minor fluctuations while preserving meaningful momentum shifts.
- Volatility-Adjusted Thresholds: Dynamic upper and lower bounds adapt to market volatility, helping identify overextended bullish or bearish conditions.
- Optional Signal Markers: Buy/Sell triangles indicate potential turning points when momentum reaches critical levels, aiding trade timing and decision-making.
- Visual Enhancements: Customizable area fills, line colors, and optional candle tinting allow traders to quickly interpret momentum, bias, and trend direction.
- Flexible Timeframe Compatibility: Effective across all timeframes, from 1-minute intraday charts to daily and weekly analysis.
How It Works
FlowShift calculates the displacement of price from a baseline moving average to identify deviations from the prevailing trend. This displacement is normalized and smoothed using exponential moving averages, producing a clean oscillator line that highlights genuine momentum changes. The oscillator’s dynamic thresholds are determined by a percentile of recent absolute values, providing an adaptive reference for extreme conditions in both bullish and bearish markets.
Signals
- Buy Signal: Triggered when the oscillator crosses above prior lows in an oversold region, suggesting potential upward momentum.
- Sell Signal: Triggered when the oscillator crosses below prior highs in an overbought region, indicating potential downward momentum.
- Signals are optional and can be displayed as triangles on the chart to clearly mark potential entry and exit points.
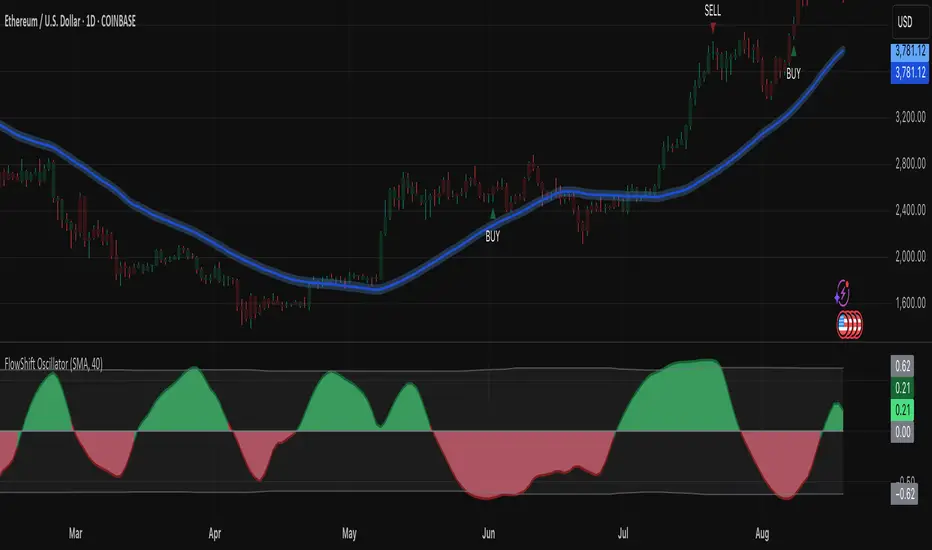
Visual Interpretation
- FlowShift Line & Area: The oscillator line and area highlight momentum direction and intensity. Upward momentum is shown in green tones, downward momentum in red.
- Baseline MA & Glow: Displays the selected baseline moving average with optional glow for trend reference.
- Candle Tinting: Optionally tints bars based on the baseline MA bias, providing an at-a-glance view of market sentiment.
Usage Notes
- FlowShift is best used in conjunction with other trend confirmation tools or support/resistance analysis.
- Dynamic thresholds help identify potential reversal points, but traders should consider overall market context and not rely solely on signals.
- Customize the baseline MA type and length to fit your trading style; shorter lengths increase sensitivity, while longer lengths provide smoother trend representation.
- Use the optional signal markers as guidance for trade timing, combining with risk management strategies for optimal results.
Conclusion
FlowShift Oscillator delivers a powerful, adaptive, and visually intuitive approach to momentum analysis. By combining baseline trend assessment, normalized momentum, and dynamic volatility scaling, it enables traders to anticipate market shifts, spot trend accelerations, and make timely trading decisions across a wide range of markets and timeframes.
開源腳本
秉持TradingView一貫精神,這個腳本的創作者將其設為開源,以便交易者檢視並驗證其功能。向作者致敬!您可以免費使用此腳本,但請注意,重新發佈代碼需遵守我們的社群規範。
免責聲明
這些資訊和出版物並非旨在提供,也不構成TradingView提供或認可的任何形式的財務、投資、交易或其他類型的建議或推薦。請閱讀使用條款以了解更多資訊。
免責聲明
這些資訊和出版物並非旨在提供,也不構成TradingView提供或認可的任何形式的財務、投資、交易或其他類型的建議或推薦。請閱讀使用條款以了解更多資訊。