OPEN-SOURCE SCRIPT
Multiple Ema's
This indicator plots five customizable Exponential Moving Averages (EMAs) directly on your chart, helping you analyze price trends and identify potential support/resistance zones more effectively.
Features:
Five EMAs with adjustable lengths: Quickly set the periods for each EMA (default: 10, 20, 50, 100, 200).
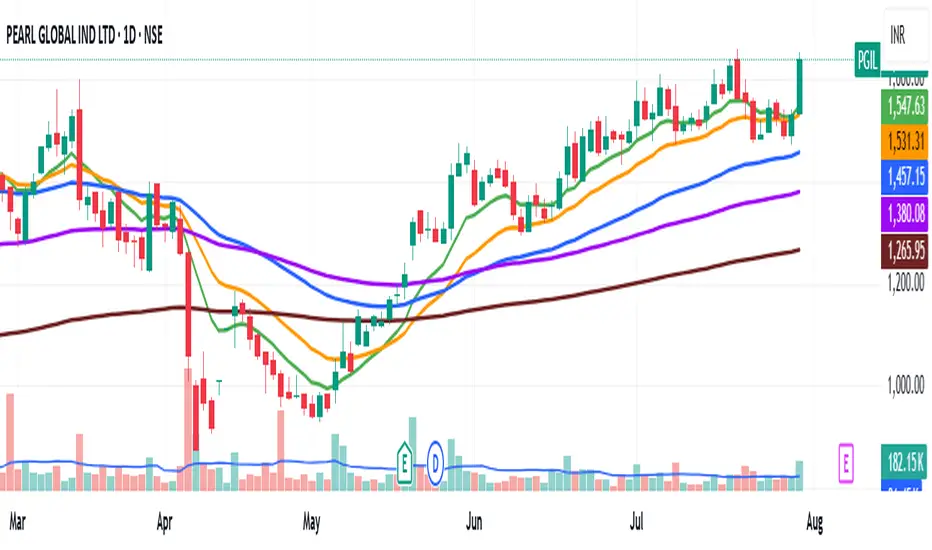
Clear, color-coded lines: Each EMA is plotted with a distinct color for easy visualization:
EMA 1 (Green)
EMA 2 (Orange)
EMA 3 (Blue)
EMA 4 (Purple)
EMA 5 (Brown)
Overlay on price chart: All curves are shown directly on your main chart for seamless trend analysis.
How to Use:
Use this indicator to:
Identify short-, medium-, and long-term trends by observing the relationships and crossovers between the EMAs.
Spot momentum shifts and potential entry/exit opportunities when price crosses above or below multiple EMAs.
Fine-tune EMA periods to your own trading strategy using the input settings.
Ideal for:
Traders and investors seeking a flexible, multi-timeframe EMA solution for stocks, forex, crypto, or any market.
Tip: Experiment with EMA lengths to match your trading style or combine with other indicators for even stronger signals!
Features:
Five EMAs with adjustable lengths: Quickly set the periods for each EMA (default: 10, 20, 50, 100, 200).
Clear, color-coded lines: Each EMA is plotted with a distinct color for easy visualization:
EMA 1 (Green)
EMA 2 (Orange)
EMA 3 (Blue)
EMA 4 (Purple)
EMA 5 (Brown)
Overlay on price chart: All curves are shown directly on your main chart for seamless trend analysis.
How to Use:
Use this indicator to:
Identify short-, medium-, and long-term trends by observing the relationships and crossovers between the EMAs.
Spot momentum shifts and potential entry/exit opportunities when price crosses above or below multiple EMAs.
Fine-tune EMA periods to your own trading strategy using the input settings.
Ideal for:
Traders and investors seeking a flexible, multi-timeframe EMA solution for stocks, forex, crypto, or any market.
Tip: Experiment with EMA lengths to match your trading style or combine with other indicators for even stronger signals!
開源腳本
秉持TradingView一貫精神,這個腳本的創作者將其設為開源,以便交易者檢視並驗證其功能。向作者致敬!您可以免費使用此腳本,但請注意,重新發佈代碼需遵守我們的社群規範。
免責聲明
這些資訊和出版物並非旨在提供,也不構成TradingView提供或認可的任何形式的財務、投資、交易或其他類型的建議或推薦。請閱讀使用條款以了解更多資訊。
開源腳本
秉持TradingView一貫精神,這個腳本的創作者將其設為開源,以便交易者檢視並驗證其功能。向作者致敬!您可以免費使用此腳本,但請注意,重新發佈代碼需遵守我們的社群規範。
免責聲明
這些資訊和出版物並非旨在提供,也不構成TradingView提供或認可的任何形式的財務、投資、交易或其他類型的建議或推薦。請閱讀使用條款以了解更多資訊。