INVITE-ONLY SCRIPT
已更新 Trading Trend Indicator
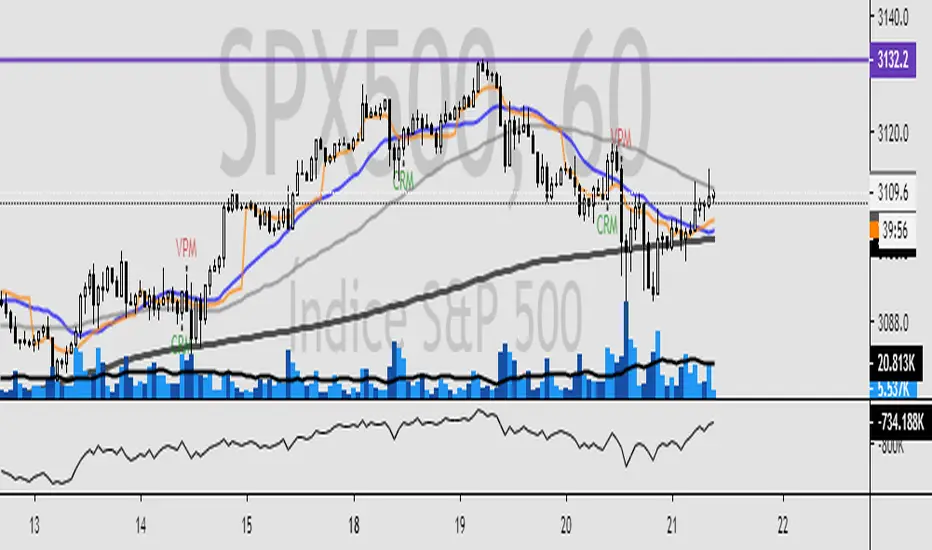
Esse indicador plota na tela do ativo avaliado, pontos de compra e venda baseado em regras de tendência e confirmação por volume. Caso o ativo entre em tendência, o script plota na tela os dizeres "CPM" = Comprar na perda da máxima, ou seja comprar assim que o preço perder a máxima no próximo candle, e "VPM" = Vender na perda da mínima, assim que o preço perder a mínima no próximo candle. O indicador também avalia o volume, se o volume for 3x superior a média de 21 períodos, plota-se na tela "Vol. 3x" e se a barra de volume for 3x maior que a barra anterior, plota-se "3x" sobre o gráfico de volume.
Caso tenham interesse, solicitem o teste gratuito de 7 dias.
Description in english
This indicator plots on the screen of the evaluated asset, points of purchase and sale based on trend rules and confirmation by volume. If the asset is in trend, the script will display the words "CPM" = Buy at the loss of the maximum, ie to buy as soon as the price loses the maximum in the next candle, and "VPM" = Sell at the minimum loss, so that the price to lose the minimum in the next candle. The indicator also evaluates the volume, if the volume is 3x higher than the average of 21 periods, it is plotted in the "Vol 3x" screen and if the volume bar is 3x larger than the previous bar, it is plotted "3x" on the volume chart.
If you are interested, request a free 7-day trial.
發行說明
Atualizações no código.發行說明
Atualizações gerais發行說明
Inclusão de novos parâmetros de entrada baseado em distorções do mercado.發行說明
Atualizações gerais no código.發行說明
Atualizações gerais no código.僅限邀請腳本
只有經作者授權的使用者才能訪問此腳本,且通常需付費。您可以將此腳本加入收藏,但需先向作者申請並獲得許可後才能使用 — 點擊此處了解更多。如需更多詳情,請依照作者說明或直接聯繫Trading_Trend_BR。
除非您完全信任其作者並了解腳本的工作原理,否則TradingView不建議您付費或使用腳本。您也可以在我們的社群腳本中找到免費的開源替代方案。
作者的說明
提醒:在請求訪問權限之前,請閱讀僅限邀請腳本指南。
免責聲明
這些資訊和出版物並不意味著也不構成TradingView提供或認可的金融、投資、交易或其他類型的意見或建議。請在使用條款閱讀更多資訊。
僅限邀請腳本
只有經作者授權的使用者才能訪問此腳本,且通常需付費。您可以將此腳本加入收藏,但需先向作者申請並獲得許可後才能使用 — 點擊此處了解更多。如需更多詳情,請依照作者說明或直接聯繫Trading_Trend_BR。
除非您完全信任其作者並了解腳本的工作原理,否則TradingView不建議您付費或使用腳本。您也可以在我們的社群腳本中找到免費的開源替代方案。
作者的說明
提醒:在請求訪問權限之前,請閱讀僅限邀請腳本指南。
免責聲明
這些資訊和出版物並不意味著也不構成TradingView提供或認可的金融、投資、交易或其他類型的意見或建議。請在使用條款閱讀更多資訊。