OPEN-SOURCE SCRIPT
Breakeven Line Demo
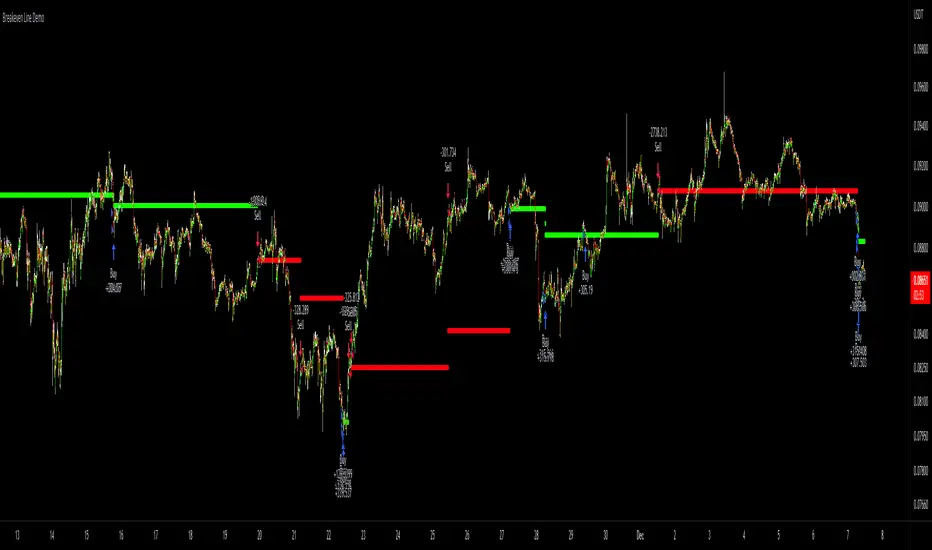
Plug the breakeven line code into the bottom of your strategy to get visualization of your breakeven price. Line is green when net position is long, red when net short and invisible when strategy is risk neutral. Most useful for strategies which use pyramiding (successive entries in same direction stacked upon each other) as it can be difficult to track where prices needs to return to to allow closing in profit. Disclaimer: the strategy logic is garbage do not use it. It is only there so you can see how Breakeven Line logic is implemented.
開源腳本
秉持TradingView一貫精神,這個腳本的創作者將其設為開源,以便交易者檢視並驗證其功能。向作者致敬!您可以免費使用此腳本,但請注意,重新發佈代碼需遵守我們的社群規範。
免責聲明
這些資訊和出版物並非旨在提供,也不構成TradingView提供或認可的任何形式的財務、投資、交易或其他類型的建議或推薦。請閱讀使用條款以了解更多資訊。
開源腳本
秉持TradingView一貫精神,這個腳本的創作者將其設為開源,以便交易者檢視並驗證其功能。向作者致敬!您可以免費使用此腳本,但請注意,重新發佈代碼需遵守我們的社群規範。
免責聲明
這些資訊和出版物並非旨在提供,也不構成TradingView提供或認可的任何形式的財務、投資、交易或其他類型的建議或推薦。請閱讀使用條款以了解更多資訊。