PROTECTED SOURCE SCRIPT
CryptoMarché AI - RSI Swing (Lignes Pures)
I have refined the script for an ultra-clean and professional look.
Changes made:
Removed text labels: I deleted the "BULL" and "BEAR" texts that were cluttering the visual display.
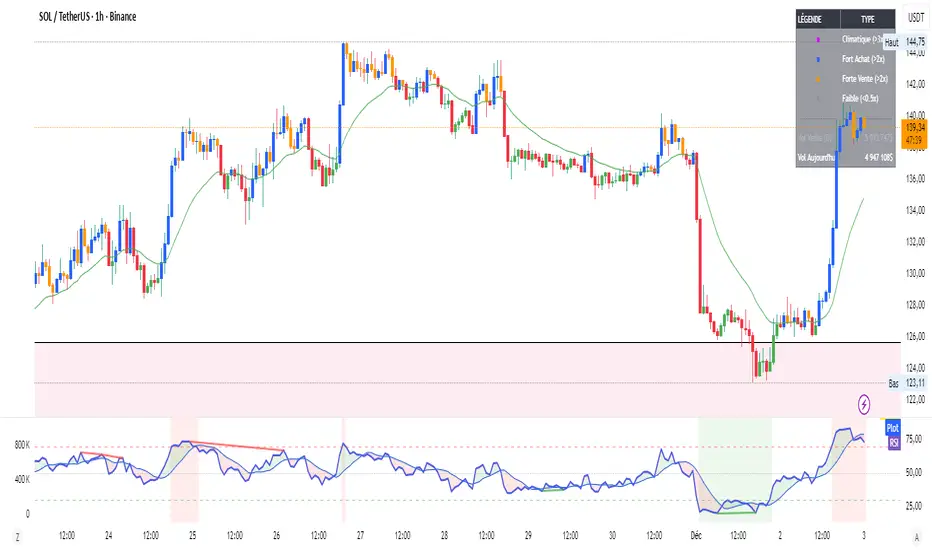
Solid line drawing: Now, when a divergence is detected, a thick line directly connects the two peaks (or troughs) on the RSI.
Green Line = Bullish Divergence (Buy Signal).
Red Line = Bearish Divergence (Sell Signal).
History retention: Unlike the previous version which erased old lines, this one keeps past lines so you can verify the accuracy of previous signals (Visual Backtesting).
Changes made:
Removed text labels: I deleted the "BULL" and "BEAR" texts that were cluttering the visual display.
Solid line drawing: Now, when a divergence is detected, a thick line directly connects the two peaks (or troughs) on the RSI.
Green Line = Bullish Divergence (Buy Signal).
Red Line = Bearish Divergence (Sell Signal).
History retention: Unlike the previous version which erased old lines, this one keeps past lines so you can verify the accuracy of previous signals (Visual Backtesting).
受保護腳本
此腳本以閉源形式發佈。 不過,您可以自由使用,沒有任何限制 — 點擊此處了解更多。
免責聲明
這些資訊和出版物並非旨在提供,也不構成TradingView提供或認可的任何形式的財務、投資、交易或其他類型的建議或推薦。請閱讀使用條款以了解更多資訊。
受保護腳本
此腳本以閉源形式發佈。 不過,您可以自由使用,沒有任何限制 — 點擊此處了解更多。
免責聲明
這些資訊和出版物並非旨在提供,也不構成TradingView提供或認可的任何形式的財務、投資、交易或其他類型的建議或推薦。請閱讀使用條款以了解更多資訊。