OPEN-SOURCE SCRIPT
已更新 Tenkan-Sen Kijun-Sen Distance (TKD) Oscillator - Ichimoku
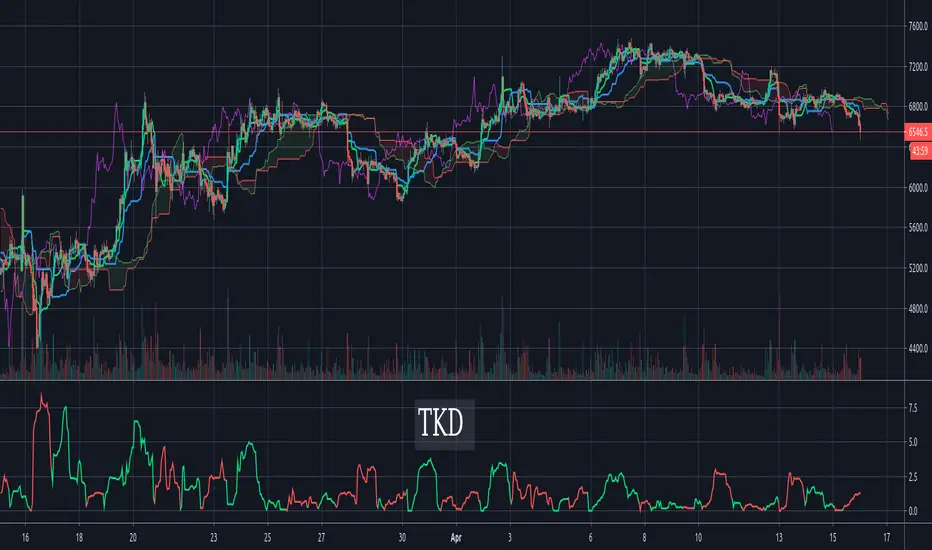
The TKD is the distance between the Tenkan-Sen and the Kijun-Sen, expressed in percentage of current price. The further apart the tenken-sen and kijun-sen are, the more they want to snap back together. This makes for a decent oscillator. When the Tenkan-Sen is above the Kijun-Sen, the TKD is green. When it is below, the TKD is red. At the crossing points, it turns blue.
For those more familiar with Ichimoku Cloud techniques, one might also think of this indicator as a C-Clamp indicator. Bar coloring is supported and enabled by default. There's also an option to flip/invert the green/red colors in case you want to use it to judge pending cycles rather than current ones.
For those more familiar with Ichimoku Cloud techniques, one might also think of this indicator as a C-Clamp indicator. Bar coloring is supported and enabled by default. There's also an option to flip/invert the green/red colors in case you want to use it to judge pending cycles rather than current ones.
發行說明
Now gives a much earlier signal since now we're figuring out what the new signal is going to be based on what the last signal was before the cross started. This also means no more blue/indecision lines. Could it reverse in the middle of the cross? Sure but that has a low probability of happening.開源腳本
秉持TradingView一貫精神,這個腳本的創作者將其設為開源,以便交易者檢視並驗證其功能。向作者致敬!您可以免費使用此腳本,但請注意,重新發佈代碼需遵守我們的社群規範。
免責聲明
這些資訊和出版物並非旨在提供,也不構成TradingView提供或認可的任何形式的財務、投資、交易或其他類型的建議或推薦。請閱讀使用條款以了解更多資訊。
免責聲明
這些資訊和出版物並非旨在提供,也不構成TradingView提供或認可的任何形式的財務、投資、交易或其他類型的建議或推薦。請閱讀使用條款以了解更多資訊。