OPEN-SOURCE SCRIPT
已更新 Rolling CAGR
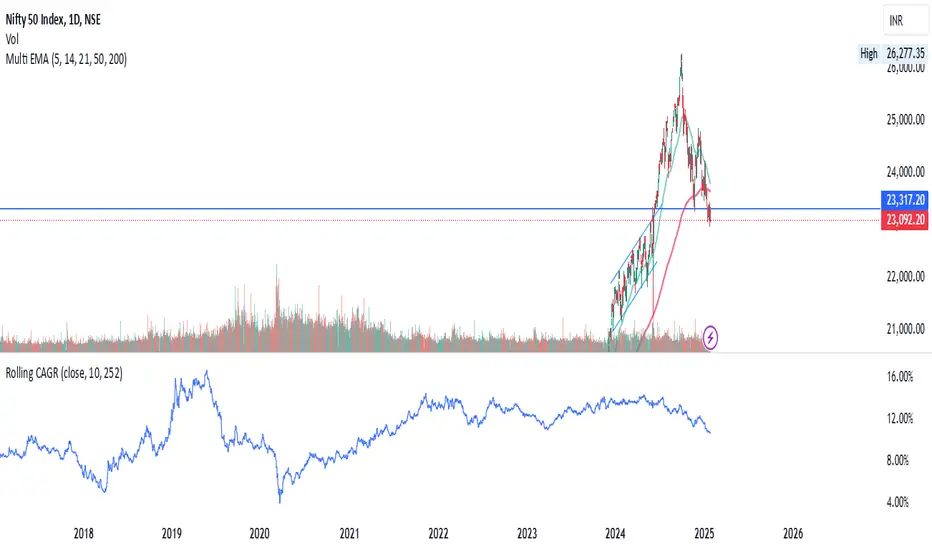
Rolling CAGR (Compound Annual Growth Rate) Indicator
This indicator calculates and plots the rolling Compound Annual Growth Rate (CAGR) for any selected data source. CAGR represents the mean annual growth rate of an investment over a specified time period, taking into account the effect of compounding.
Features:
• Customizable data source (default: close price)
• Adjustable time period in years
• Configurable trading days per year (252 for stocks, 365 for crypto)
• Results displayed as percentage values
• Works on daily timeframes
Input Parameters:
• Data Source: Select the price or indicator data to analyze
• Number of Years: Set the lookback period for CAGR calculation
• Trading Days in a Year: Adjust based on market type (252 for stocks, 365 for crypto)
Usage:
Perfect for analyzing long-term growth rates and comparing investment performance across different periods. The indicator provides a rolling view of compound growth, helping traders and investors understand the sustained growth rate of an asset over their chosen timeframe.
Note: This indicator is designed for daily timeframes as CAGR calculations are most meaningful over longer periods.
Formula Used:
CAGR = (End Value / Start Value)^(1/number of years) - 1
發行說明
Rolling CAGR (Compound Annual Growth Rate) IndicatorThis indicator calculates and plots the rolling Compound Annual Growth Rate (CAGR) for any selected data source. CAGR represents the mean annual growth rate of an investment over a specified time period, taking into account the effect of compounding.
Features:
• Customizable data source (default: close price)
• Adjustable time period in years
• Configurable trading days per year (252 for stocks, 365 for crypto)
• Results displayed as percentage values
• Works on daily timeframes
Input Parameters:
• Data Source: Select the price or indicator data to analyze
• Number of Years: Set the lookback period for CAGR calculation
• Trading Days in a Year: Adjust based on market type (252 for stocks, 365 for crypto)
Usage:
Perfect for analyzing long-term growth rates and comparing investment performance across different periods. The indicator provides a rolling view of compound growth, helping traders and investors understand the sustained growth rate of an asset over their chosen timeframe.
Note: This indicator is designed for daily timeframes as CAGR calculations are most meaningful over longer periods.
Formula Used:
CAGR = (End Value / Start Value)^(1/number of years) - 1
開源腳本
秉持TradingView一貫精神,這個腳本的創作者將其設為開源,以便交易者檢視並驗證其功能。向作者致敬!您可以免費使用此腳本,但請注意,重新發佈代碼需遵守我們的社群規範。
免責聲明
這些資訊和出版物並非旨在提供,也不構成TradingView提供或認可的任何形式的財務、投資、交易或其他類型的建議或推薦。請閱讀使用條款以了解更多資訊。
開源腳本
秉持TradingView一貫精神,這個腳本的創作者將其設為開源,以便交易者檢視並驗證其功能。向作者致敬!您可以免費使用此腳本,但請注意,重新發佈代碼需遵守我們的社群規範。
免責聲明
這些資訊和出版物並非旨在提供,也不構成TradingView提供或認可的任何形式的財務、投資、交易或其他類型的建議或推薦。請閱讀使用條款以了解更多資訊。